Will spring snow melt in the Arctic occur earlier or later?

January 10, 2013 – 11:10 am

I keep thinking about this question as I write up the results of our project. I posted about it once before here. On the one hand, warmer temperatures should melt snow earlier. On the other hand, warmer air holds more water, which can increase snowfall and snowpack depth. Deeper snowpacks may melt out later.

A broad summary study by Callaghan et al. reports the recent history:

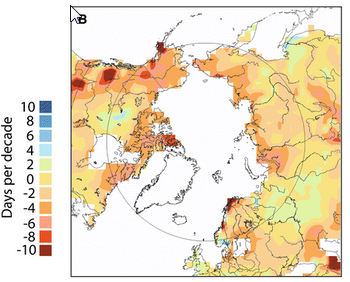
[Changing temperature and moisture regimes are] driving significant changes in the snow regime particularly during the spring season when snow cover disappeared earlier at an average rate of 3.4 days per decade over the pan-Arctic terrestrial region (excluding Greenland) during 1972–2009.

And on future projections they write:

Projected changes in snow cover from Global Climate Models for the 2050 period indicate increases in maximum SWE of up to 15% over much of the Arctic, with the largest increases (15–30%) over the Siberian sector. In contrast, SCD is projected to decrease by about 10–20% over much of the Arctic, with the smallest decreases over Siberia (<10%) and the largest decreases over Alaska and northern Scandinavia (30–40%) by 2050.

Here’s a graph they included showing spatial variation in the change of timing of spring snowmelt:

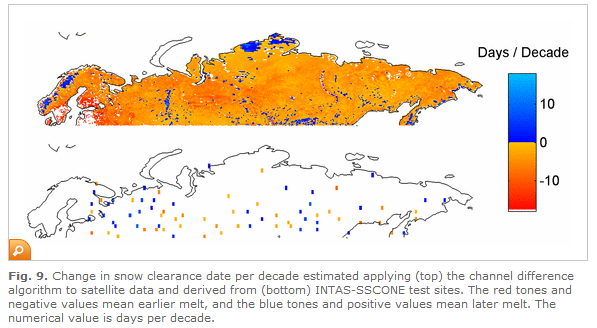
Another study in Eurasia appears to support this finding:

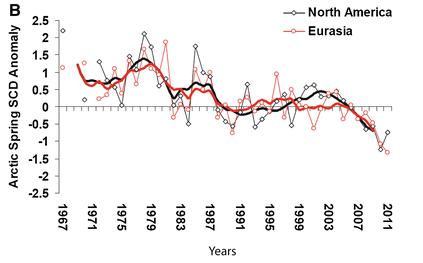
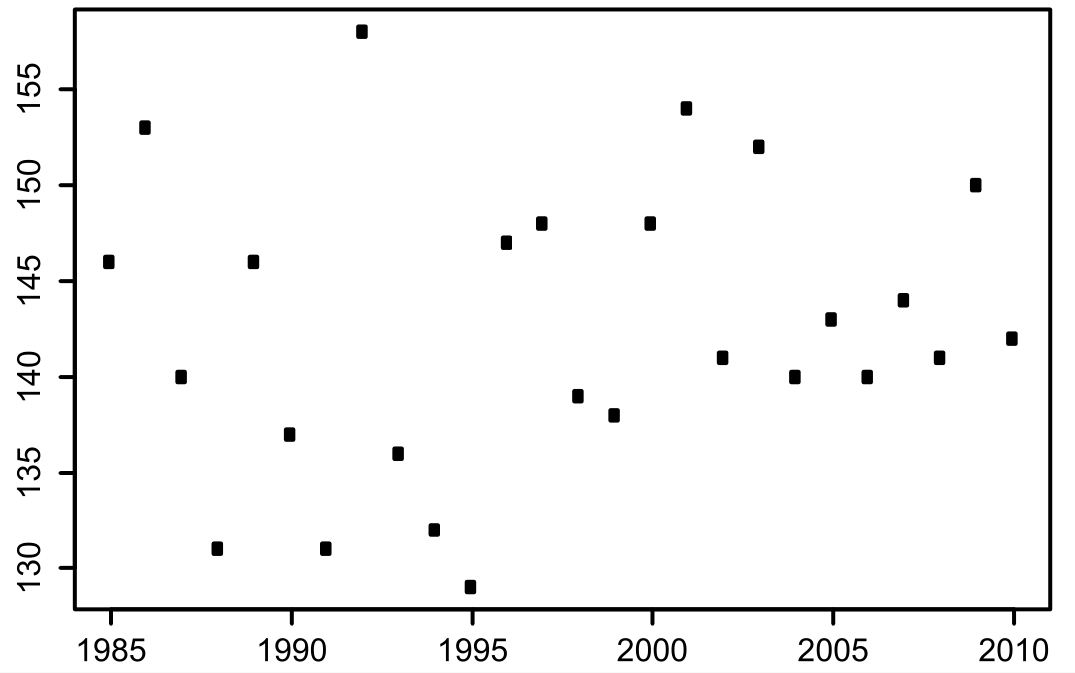
The only downside to these analyses is that the underlying data (below shown from the first study, Callaghan et al.) are a bit noisy and a series of late melt years, should they occur, might really change  the shape of these curves that underlie each pixel in the above maps:

In contrast to the findings mentioned in the summary study, a simulation modeling study focused specifically on Northern Alaska reports:

Despite warmer near surface atmospheric temperatures, it is found that spring melt is delayed throughout much of the North Slope due to the increased snow pack, and the growing season length is shortened.

The panarctic trends noted in the first study seem to have been even more pronounced during the last couple of years according to the study I posted about before that has now been published:

Analysis of Northern Hemisphere spring terrestrial snow cover extent (SCE) from the NOAA snow chart Climate Data Record (CDR) for the April to June period (when snow cover is mainly located over the Arctic) has revealed statistically significant reductions in May and June SCE. Successive records for the lowest June SCE have been set each year for Eurasia since 2008, and in 3 of the past 5 years for North America.

Overall, it looks like spring melt will probably be earlier and has been getting earlier as of late. However, there is some disagreement in future projections about whether Northern Alaska (and perhaps other areas) will in fact see earlier snowmelt in spring. The underlying correlations that are driving the appearance of the maps above could turn around if warmer and warmer air leads to bigger and bigger snowpacks. My one personal observation here is that warm snaps in the Arctic spring can melt snow really fast so deeper snow may not in fact melt that much more slowly.


Comments Off on Will spring snow melt in the Arctic occur earlier or later?

AGU 2012: Arctic tundra in EcoCELLs?

December 12, 2012 – 2:08 pm

Midweek at AGU I also had a nice discussion with Jay Arnone, who I worked for as an intern at the Desert Research Institute just before starting grad school. Jay has a really amazing and unique facility at the Desert Research Institute that they call the EcoCELLs. The EcoCELLs are large mesocosms in which they can monitor large intact monoliths of soil (several cubic meters).

I told Jay he should pop some Arctic tundra in there since it would allow for some nicely controlled analyses of permafrost melt and other global change effects. Turns out he had already been working on getting this funded. I really think this would be awesome, adding a nice dimension to our understanding of arctic carbon balance that can’t be easily measured with either soil cores in the lab or field experiments. The ability to get carbon flux numbers at the same resolution as eddy flux on intact plants and soils undergoing temperature manipulations is not possible with other techniques and can provide some awesome data. Hope this happens!


Comments Off on AGU 2012: Arctic tundra in EcoCELLs?

AGU 2012: Snowmelt project meeting

December 8, 2012 – 6:15 pm

Our snowmelt project group met on Wednesday to summarize our final year of field data and make plans for putting together our three years of results from the experiment. We have lots of data and had a good discussion about how to package it to best convey our main results. Below is the effect of our snowmelt acceleration treatment on the timing of melt over the three years of our project.

Image

We decided that we want to write a mix of papers that focus on single data sets and papers that combine data sets from the different aspects of the project. Some of the data sets are complex and unique, seeming to warrant their own papers while others may be better brought to light in the context of the whole experiment.

One of the challenges of combining data sets from different aspects of the project is that field data sets can be idiosyncratic, with only the data collectors having total understanding of all of the nuances. We had a nice discussion about how to make accurate conclusions when melding the different project parts. I’m greatly looking forward to this integration of data since I’ve been so focused on this project for the last three years.


Comments Off on AGU 2012: Snowmelt project meeting

AGU 2012: Changing seasonality talks

December 8, 2012 – 6:12 pm

I really enjoyed participating and contributing to the oral session I was in entitled When Winter Changes: Hydrological, Ecological, and Biogeochemical Responses. There were many great talks. I tweeted some highlights from the session.

More highlights on my twitter page.


Comments Off on AGU 2012: Changing seasonality talks

Rocky Mountain National Park panoramas

November 25, 2012 – 10:08 pm

I took these back in September and just got around to stitching them together. Click for the full versions:


Both of these are along Trail Ridge Road around 12,000 feet elevation. The road was just above a dense layer of fog.


The tundra was pretty brown by this time of year.


Comments Off on Rocky Mountain National Park panoramas

Fluorescent microplate analysis of amino acids and other primary amines in soils

October 4, 2012 – 3:18 pm

Our paper on a popular soil amino acid technique just came out in Soil Biology and Biochemistry. We got interested in improving this method and adapting it for microplates a couple years ago and after quite a bit of lab work this is the result. The abstract:

In studies of soil nitrogen (N) cycling, there is growing demand for accurate high-throughput analyses of amino acids and other small organic N compounds. We adapted an existing fluorometric amino acid method based on o-phthaldialdehyde and β-mercaptoethanol (OPAME) for use in 96-well microplates, and tested it using standards and field samples. While we started with an existing protocol, we made one critical change: instead of using a 1-min incubation period, we used a 1-h incubation period to deal with differences in reaction timing among microplate wells and to reduce interference from ammonium. Our microplate method is similar in sensitivity to existing protocols and able to determine leucine standard concentrations as low as ∼0.5 μM. Finally, we demonstrate that the OPAME reagent fluoresces in the presence of primary amines other than amino acids, such as amino sugars and tyramine. Because of this broad sensitivity to primary amines, descriptions of the measured pool should be revised from total free amino acids (TFAA) to total free primary amines (TFPA).

Reaction kinetics of primary amines and ammonium with OPAME. a. Fluorescence levels of leucine, a mixed amino acid standard, and ammonium over 3 h at 1.5 min intervals. b. Ratio of ammonium:leucine fluorescence for 20 μM standards over 3 h (mean ± 95% CI, n = 5). c. Fluorescence levels of leucine, glucosamine, tyramine, and N-acetylglucosamine over 3 h at 1.5 min intervals.


Comments Off on Fluorescent microplate analysis of amino acids and other primary amines in soils

Earlier spring in the Arctic

September 25, 2012 – 4:26 pm

There was a well reported story on NPR yesterday about recent trends in Arctic snow melt:

Derksen and colleague Ross Brown have produced a study, which has been accepted for publication in Geophysical Research Letters, that documents a dramatic increase in the speed of this snowmelt. It turns out that in May and June, snow across the far north is disappearing fast. “It’s decreasing at a more rapid rate than summer sea ice,” Derksen says. “So the loss of snow cover across the Arctic is really as big an issue as the loss of sea ice.”

It is nice to have more confirmation of this trend since it is a major premise of our Arctic field experiment.  I don’t think the paper is available online yet.
There is some interesting data from our specific site, Imnavait Creek, showing that in recent years, there has actually been a lack of early snowmelt events:

Image

That’s snowmelt day of year on the vertical axis and calendar year on the horizontal. So it is good to know that our experiment is accurately simulating a broad Arctic trend even if there has been a recent local effect that is the opposite.


Comments Off on Earlier spring in the Arctic

LTER meeting in Estes Park

September 10, 2012 – 6:44 pm

I arrived in Estes Park yesterday to attend the LTER (Long Term Ecological Research) network meeting this week. I like this meeting because there are a lot of ecosystem scientists that do work closely aligned with my interests. These are my people. I’m presenting the above poster on data from our three summers of field data from the Arctic. (click poster for pdf).


Comments Off on LTER meeting in Estes Park

A new Darrouzet-Nardi

August 17, 2012 – 12:59 am

Blog’s been on the back burner recently since the birth of my daughter Cara on June 29th:

So far a successful experiment!

I’m at Toolik right now tying up loose ends for the third and final field season of our project. When we arrived on August 11th, I was struck at how green it was here, definitely greener than last year at that time. However, within the first couple of days, the landscape turned from green to yellow and is well on its way now to red and brown. We have been busy taking a final round of soil cores and now taking the site down.

OLYMPUS DIGITAL CAMERA

Just before arriving here, I had a nice trip to ESA in Portland and saw lots of friends and lots of great talks, particularly by some of my fellow postdocs I’ve met at Toolik and elsewhere. I want to post a few observations about the conference soon.

While the tundra is enchanting as always, I can’t wait to get back home to my sweet little baby and her heroic mom.


1 Comment »

Microplate calculation spreadsheets

June 7, 2012 – 5:24 pm

Not to interrupt the flow of pretty pictures from the arctic, but I have to address an important topic: microplate calculation spreadsheets.

I know this is for a narrow audience, but I’m always surprised by how much finding random things like this online can help me, so here we go.

The goal is to paste raw microplate data into a spreadsheet and get out the final numbers you need. If you had thousands of microplates, it might be better to write a short program that can process the data, but for everyday lab analyses that change frequently and are implemented by many lab personnel that don’t program stuff, the spreadsheet is a good tool.

I’ve made a lot of these spreadsheets over the last few years to help process enzyme and nutrient data. Here’s one I made recently. It has a few parts in the different worksheets: (1) the blank template in which raw data can be pasted; (2) a pipetting map to be printed so that you know where to put your samples when you are pipetting; (3) simulated data that helps to identify the assumptions you are making about sources of well absorbance (for colorimetric assays) or in this case fluorescence; and (4) a run with the modeled data to help spot errors in the spreadsheet.

Here are some guidelines I have learned over the last couple years that I think make these spreadsheets more useful for our lab group.

(1) Label all the parameters. In particular, formulas should only have references to other cells, not any hard values like mass of soil used or volume of extractant, etc. This will prevent having to search all cells whenever you change one of these variables.

(2) Highlight anything you have to enter when samples are run so you don’t forget anything.

(3) Don’t make overly complicated formulas that are difficult to decipher later. To prevent this, divide up long calculations into two or more steps so each is more clear.

(4) Test the spreadsheet with simulated data that you create to look similar to real data but with nice round values. This will help you identify assumptions in the way calculations are made as well as locate typos in calculations across many spreadsheet cells.

(5) Make the output of your spreadsheet into a well organized table (below) that has only sample ID information and the final values in preferred units. Then you can grab these values to use for stats and comparison with other assays, leaving all the processing behind.


Comments Off on Microplate calculation spreadsheets

Last day at Toolik

May 28, 2012 – 10:02 pm

I take off from Toolik the day after tomorrow. Here’s a time series of photos from our experiment, starting on April 28, and ending on May 27. The acclerated plots melted about 10 days before the control plots.

Control plot:

Snowmelt acceleration plot:
Here’s the whole series from last year.


Comments Off on Last day at Toolik

Solar Eclipse at Toolik

May 20, 2012 – 9:47 pm

Toolik Eclipse

5:20 p.m. Taken through a piece of welding mask glass.


Comments Off on Solar Eclipse at Toolik

Vole attack

May 18, 2012 – 9:06 pm

tussock in OTC dug up by vole

We were monitoring plants in our freshly melted tundra plots and we noticed that this Eriophorum had signs of herbivory.

vole hay

The vegetation and organic material had been turned into hay piles by a vole.

Then, like Kane, as we stood up and looked around, we realized they were EVERYWHERE.


2 Comments »

More caribou pictures

May 3, 2012 – 7:44 pm

Click for bigger versions


Caribou (dots on lower right) grazing by moonlight in front of the Brooks Range. I think they are eating the tasty vegetation in the long-term fertilized research plots. This was about 10:30 p.m. last night. Temp was around –5°F.


They are very focused on eating and rarely look up.


This one must have an itch or something.


Speck-sized caribou on a distant ridge grazing in front of the arctic sunset.


Update (5/4): Saw a herd running today.


Caribou beneath the “supermoon

Image
Update (5/7): Finally got a decent closeup


2 Comments »

Snowmelt Project: Year 3

April 28, 2012 – 8:00 pm

Today, for the third and final year of this project, Sadie and I got our snowmelt acceleration treatment up and running.

This is the site after we deployed shadecloth on our five accelerated snowmelt plots.


There are tons of caribou around right now. These guys wandered near our plots, then took off after staring at us for a while.

The deployment went great. The snow looked good and the weather was excellent. If temperatures stay this warm, melt will be quick!


2 Comments »

Writing Science

April 20, 2012 – 12:22 pm

Our lab group just finished reading this book by Josh Schimel. We read two chapters a week and discussed them, which was a nice pace for absorbing the material. It’s easy to read, but there is so much good advice that it’s nice to have time for it to sink in.

Overall, the book is fantastic. It feels like a secret weapon. I can’t recommend it enough for any science writer at any stage. At the book’s Amazon page, I felt similarly to this reviewer:

I have 70 published papers in international, peer-reviewed journals; and I want to go back to each and every one of them and rewrite them with the messages from this book clear in my head and clear to the reader.

Fortunately I found the book earlier than this guy, but I am also eyeing my past papers and realizing how I could have made them much better.


2 Comments »

Global seasonality

April 17, 2012 – 3:50 pm


I tweeted:

I’m referring to the animated gif above. Click for the full size version.

I then had the following email exchange with my mom:

Mom: Anthony, what is going on in that graphic? Is it a joke?

Me: lol no joke, it’s actual satellite images of seasonal change in earth surface color throughout the year. Mainly you can see snow extent and when different parts of the world are in their growing seasons.

Mom: Ah ok — so what ten things did you learn? Clearly you need specialized knowledge to interpret that animation.

Challenge accepted! Here are 10 things I did not know before staring at this graphic for a while:

1. While there is permanent snow/ice cover in Antarctica, there is almost no seasonal snow cover in the southern hemisphere.

2. Permanent snow/ice cover near the north pole includes not just Greenland, but also many other large islands in northern Canada like the Sverdrup islands.

3. During the winter, the boreal forest is not as white as the tundra above or the plains below (lower albedo), presumably due to the trees poking out from the snow.

4. In Australia, plants on the northern coast green up in the summer while plants on the southern coast green up in the winter.

5. A huge swath of Brazil has deciduous vegetation (also, Madagascar).

7. The rainforests of South America, Africa, and Southeast Asia that stay green all year round are a lot greener than even peak greenness in the nearby seasonal ecosystems.

8. The permanent snow in the Himalayas is mostly constrained to a thin band where the subcontinent is smashing into Asia.

9. The Amazon river becomes so massive during the rainy season you can see it from space (at least I assume that is what’s going on there).

10. The Nile River delta dries up twice a year. Notice how it flickers more than once per annual cycle in the gif. Here’s an animation that confirms this.

Also, this is more geography, but I had never noticed the Kerguelen Islands before. Looks like it is pretty snowy there in the winter.

And a final observation from an imgur commenter in Britain:


4 Comments »

ggplot2: I’m a convert

April 12, 2012 – 4:56 pm

I have been using lattice  for my R graphics for years, and it is a great software package based on William Cleveland’s groundbreaking approach to analyzing data. However, a few weeks ago I was trying to show data points, means, and summary bars in the same graphic, a task that should be straightforward in a graphics environment. This is not impossible in lattice, but does involve writing a cumbersome “panel function.” This approach was great for its time – when lattice came out there was nothing else like it – but unfortunately it has not evolved into a more user-friendly system.

Having read about ggplot2, I knew that it had a more modular system where you can add or subtract different graphical elements such as summary stats or data points at will. So, I tried it for the data I was working on and never looked back.

Here’s my first ggplot2 figure that drew me to switch:

It took minimal effort to learn the ggplot2 system. In addition to the useful modular design, the default approaches to tasks such as automatic legend creation, log axes, and jittering are well done.

While I know an upgrade when I see one, I will also miss lattice since I think it’s a fantastic piece of open source software that was my analysis workhorse for the last eight years. It was also one of the packages that really motivated me to learn R.


Comments Off on ggplot2: I’m a convert

Plant stress master variable: non-structural carbon?

April 6, 2012 – 4:05 pm

Our lab group recently read a 2010 review paper by Ülo Niinemets that presents the interesting hypothesis that the effects of various stresses on tree behavior can be summarized using the master variable of “nonstructural” or “storage” carbon. The idea is that if the plant is doing well, it will store extra carbon to use in case of stress such as waterlogging, heat wave, water stress, or anything else that prevents it from photosynthesizing. When stresses arrive, the trees start using up that carbon. When the storage carbon is gone, they are at risk of death if the stress does not end:

Currently the effects of various stresses cannot be deconvoluted in field environments, but storage carbon size likely provides an important point of convergence of various stress pathways. The predictions based on non-structural carbon pools suggest that maintenance of higher storage carbon pools increases the tolerance of sustained stress.

Could understanding plant stress be as simple as this? Probably not, but it’s a nice place to start. We are thinking about doing some preliminary analyses with some of our arctic plants. Our idea is to take plant tissues, enzymatically degrade the starches into sugar and then measure the total sugar pool. We think that our snowmelt acceleration treatment may be stressing the plants. If we do see reductions in nonstructural carbon in those plants, it would be consistent with our hypothesis of plant stress and could provide a nice piece of evidence. The review also mentions that in the future, we may find more sophisticated correlates like VOCs to help us nondestructively assess plant stress level.


2 Comments »

One of my favorite book lists

April 2, 2012 – 4:33 pm

Here’s a list I got from an Edward Tufte one-day seminar in 2001. I read a lot of the books on the list (you can see my library call numbers I scrawled on there back in the day). They were instrumental in helping me understand how to interpret and present scientific information.

The web stuff is almost certainly way out of date; everything else is still great. I particularly recommend the William Cleveland books (the one you can’t see is Visualizing Data). Statistics classes should start with Visualizing Data instead of standard textbooks.

Edward Tufte still does the one day course and it is excellent. Grad students in particular are at a great stage to benefit, so I highly recommend it to them.


2 Comments »

Spring has begun in Toledo

March 26, 2012 – 4:54 pm


It’s been an early spring here in Toledo and indeed throughout the Eastern United States. In Washington DC, the cherry blossoms peaked on March 20, one of the earlier recorded dates.


NPR even ran a fun story about phenology, the study of the timing of biological events like plant flowering dates.

This Magnolia is right around the corner from our house. Nice!


Comments Off on Spring has begun in Toledo

Cool trend: the video abstract

March 9, 2012 – 1:03 pm

Here’s my friend Jennie McLaren’s video abstract for her presentation at the International Polar Year conference:

Here’s one about Arctic ground squirrels by another Toolik friend, Michael Sheriff:

And there are a bunch more in the IPY channel. These videos have been viewed dozens of times, which doesn’t sound like a lot, but is probably already more times than all of my previous conference abstracts combined have been read. Cool science projects and youtube seem to go together well. The one-minute length is smart too.


Comments Off on Cool trend: the video abstract

Documentary: If a Tree Falls

March 6, 2012 – 8:33 pm

Last weekend, I enjoyed watching If a Tree Fallsa documentary about a group of arsonists in the Earth Liberation Front. The film was both educational and a fascinating story. It illuminates some important aspects to environmental activism in the 1990s and early 2000s and the filmmakers do a great job of answering an obvious question: what were the arsonists thinking? It also has an interesting sort of reverse mystery — we already know whodunnit, but it’s interesting to see who figured it out and how.

One of the fun things for me in watching the story unfold was that I remember seeing news stories about a lot of the events in the film and I feel like I have been on the periphery of the communities in which the events took place. I remember protesting old-growth logging with a youth environmental group when I was in high school. I remember hearing about the “black bloc” anarchists from friends who attended the Seattle WTO protests when I was in college. I remember hearing about the burning of a scientific poplar plantation in Oregon from a guest speaker at CU as a grad student.

While I obviously don’t agree with arson as a tactic, I and many other environmentalists are in the awkward position of agreeing with the arsonists on some of the issues that motivated them. For example, it is in fact tragic and shortsighted to clear-cut the few remaining old growth forests on the west coast. Also, the frenzy to brand people “terrorists” so that prosecutors and law enforcement can claim to have bagged them is worrisome. In the end, I don’t think their misguided approach to addressing these problems has had a huge impact one way or another because it is clear that they are well outside of the mainstream.


4 Comments »

Blowing snow in the alpine

March 1, 2012 – 5:29 pm

Here are some fun videos of blowing snow on Niwot Ridge from a couple of days ago. Winds can top 120 mph up there.

Blowing snow is an important physical process that shapes ecosystem function in the alpine tundra. Here’s a figure from a good overview of alpine ecosystems:


The mesotopographic model developed by Billings (1973). Alpine plant communities are formed by the spatial gradients created by snow cover, which is generated by wind exposure and topographic position.


Comments Off on Blowing snow in the alpine

Spatial biogeochemistry

February 25, 2012 – 12:30 pm

I’ve seen a couple interesting papers recently on spatial biogeochemistry, a topic I enjoyed working on during my dissertation. Here’s how I described the importance of spatial biogeochemistry in one of my dissertation papers. In this case, I was discussing nitrogen (N) import and export from ecosystems, but the same case can be made for other biogeochemical processes.

Our current understanding of N import and export is based primarily on point estimates or on integrated estimates from hydrologic data. While these estimates provide a valuable foundation for understanding these processes, more detailed measurements that take spatial heterogeneity into account are likely to reveal important biogeochemical phenomena at larger scales, especially in the complex terrain of mountain ecosystems.

In a study of interannual variation in landscape carbon flux, Diego Riveros-Iregui and his colleagues found that:

Based on soil respiration measurements taken at a subalpine forest in central Montana, we found that locations with high drainage areas (i.e., lowlands and wet areas of the forest) had higher cumulative soil respiration in dry years, whereas locations with low drainage areas (i.e., uplands and dry areas of the forest) had higher cumulative soil respiration in wet years.

A nice finding. From this, they conclude:

These results highlight that evaluating and predicting ecosystem-scale soil C response to climate fluctuation requires detailed characterization of biophysical-topographic interactions in addition to biophysical-climate interactions.

I think they are correct that taking spatial variation into account is one of final frontiers in understanding ecosystem carbon cycling. Diego was a postdoc at CU when I was  a grad student there; now he’s faculty at the University of Nebraska. They are lucky to have him as I think he is becoming a leader in this research area.

In another recent study of N export from watersheds, Ross et al. were able to make a quantitative link between the magnitude of soil processes and N export in streams.

Stream NO3 export was positively related to nitrification rates … These spatial relationships found here suggest a strong influence of near-stream and near-watershed-outlet soils on measured stream NO3 export.

There were a few caveats to this relationship, but it is impressive that they were able to document this link at all since it is difficult to meaningfully measure the magnitude of these soil microbial processes.


Comments Off on Spatial biogeochemistry

Research Works Act, ctd.

February 3, 2012 – 12:54 pm

There has been some interesting development in the case of the Research Works Act. Some grassroots activism has now forced Elsevier to respond to the criticisms of scientists:

A protest against Elsevier, the world’s largest scientific journal publisher, is rapidly gaining momentum since it began as an irate blog post at the end of January. By Tuesday evening, about 2,400 scholars had put their names to an online pledge not to publish or do any editorial work for the company’s journals, including refereeing papers.

Elsevier did provide a little bit more information on what they see as their role in adding value to scientific research:

“What publishers charge for is the distribution system. We identify emerging areas of research and support them by establishing journals. We pay editors who build a distinguished brand that is set apart from 27,000 other journals. We identify peer reviewers. And we invest a lot in infrastructure, the tags and metadata attached to each article that makes it discoverable by other researchers through search engines, and that links papers together through citations and subject matter. All of that has changed the way research is done today and makes it more efficient. That’s the added value that we bring.”

Judge for yourself whether you are convinced. Conspicuously missing from their comments was any indication they would retract support for the Research Works Act. There was also this:

I’m not sure why we are the focus of this boycott, but I’m very concerned about one dissatisfied scientist, and I’m concerned about 2,000.

Tough question! Here’s a hint.


1 Comment »

No such thing as humus?

January 31, 2012 – 5:39 pm

My soil nerd friends on Facebook have been linking this nice article from Science News discussing the importance of soils to global carbon among other topics. It has lots of good quotes and explanations by cutting-edge groups. One of the most interesting parts is the suggestion that there is no such thing as humus:

One old idea in particular is now in question, with the challenge culminating in a recent report in the journal Nature. Under fire is the belief that soil remains stubbornly soil, a large fraction of its organic materials resistant to decay because of the accumulation of large molecules called humic substances. One professional society devoted to the substances is in the odd position of hearing colleagues label as fiction its primary topic of study.

The idea presented in the article is that it doesn’t make sense energetically that these large resistant molecules will form in soils and that instead compounds as simple as sugars may be preserved in soils through other mechanisms. I did see a lot of talks at AGU in December about the importance of physical occlusion and other forms of stabilization in soils. I think as people continue to bring fancier methods from analytical chemistry (mass spec, HPLC, fluorometry, etc) to bear on these questions, we will in fact have to redefine what soil organic matter is chemically. However, it may be too soon to say that there is no such thing as chemical resistance to decomposition.


Comments Off on No such thing as humus?

R tip: Sorting and keeping track of many response variables

January 23, 2012 – 5:03 pm

When doing the same analyses on many different response variables, it can be hard to keep track of the variables and have R print graphs and other output with the response variables of choice in the desired order. Here’s an example of the column names from a multivariate data set I’m working with:

> names(nts.summ)
[1] "date" "Season" "Plot" "DOC" "MBC" "DON" "MB.N"
[8] "NH4" "NO3" "moisture" "NAG" "CBH" "AG" "BG"
[15] "LAP" "BXYL" "PHOS" "PHENOX" "NetPerox" "UREASE" "logNH4"
[22] "logNO3" "logLAP" "logPHENOX" "logNetPerox" "microbialCN" "extractCN" "tempmax"
[29] "tempmin" "tempmean"

To make these easier to work with, I keep a character vector with the response variable names in the desired order (variables) and then create a reference vector (y) with a short for loop:

variables = c("DOC", "DON", "extractCN", "MBC", "MB.N", "microbialCN","NH4", "NO3", "NAG", "CBH", "AG", "BG", "BXYL", "PHOS", "LAP", "PHENOX", "NetPerox", "UREASE", "moisture", "tempmean")
y = NA; for(x in 1:length(variables)) {
  y[x] <- which(names(nts.summ)==variables[x]) }

> y
[1] 4 6 27 5 7 26 8 9 11 12 13 14 16 17 15 18 19 20 10 30

Now if I want to do a scatterplot matrix or, say, print the median for each variable, I can use the reference vector y.

splom(nts.summ[y])
for (x in y) print(median(nts[,x],na.rm=T))

The reference vector y can easily be modified as the analyses evolve. For example, if I decide to switch to a log-transformed version of a few variables, I just change their names in the code for variables, create a new y, and re-run.


Comments Off on R tip: Sorting and keeping track of many response variables

Research Works Act

January 17, 2012 – 4:39 pm

Scientists’ opposition to the Research Works Act is getting a lot of attention (e.g., here and here). I feel as many scientists do that this bill would make our job of disseminating information harder in order to enrich publishers. That doesn’t seem like a good deal. At this point, it is up to the publishers to convince me that they are providing value for their work that justifies the high prices they charge.

I see scientists writing, editing, and peer reviewing manuscripts. I see publishers facilitating peer review by providing clunky and chronically out-of-date online tools as well as doing a mediocre job typesetting and copy editing our articles. In my experience, these services have been outsourced to overseas companies with poor communication skills. The typesetting and print publishing are also a waste of money since we all have internet. Their online publication systems are also clunky, with poor search functionality, spammy TOC alerts, and cookie-cutter websites.

Finally, it’s insulting when I work for years on a project and then, upon publication, have to sign over my copyright to a journal that then turns around and asks if I want to buy that copyright back for $3000 (that was what Springer asked on my last publication). The only reason I and many other scientists put up with this absurd arrangement is that the industry has been savvy about maintaining control of the high profile journals in which we need to publish to advance our careers.

Hopefully the press surrounding this issue will lead to education and grass-roots action among scientists. It may be easier than we think to submit our work to publishers that we trust to make it freely available and even deny peer review services to the worst corporate offenders like Elsevier.


Comments Off on Research Works Act

Minor data victory

January 13, 2012 – 3:29 pm

No groundbreaking discoveries or anything – I was just pleased to see that we got a good match between two runs of the same samples (units are µM amino acids). I’ve been working on a microplate procedure for measuring total free amino acids in soil extracts with our lab tech Mallory. These results are good since we’ve been running this procedure on hundreds of samples over the last two weeks. This is also the last data we need for a short note we are writing on the procedure, so it’s a nice way to start the weekend.


1 Comment »