Postdoctoral position studying critical zone processes in drylands

October 22, 2020 – 12:55 pm

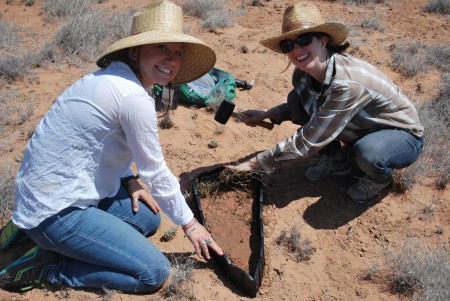
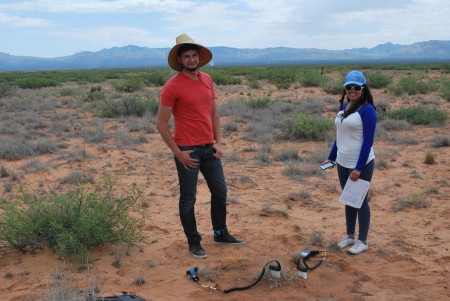
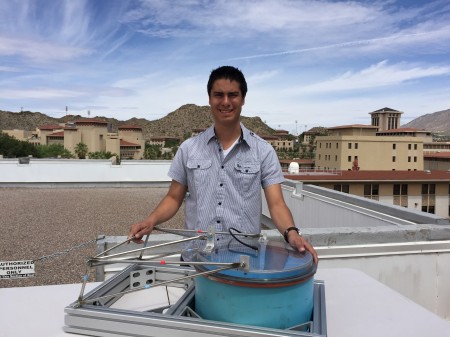
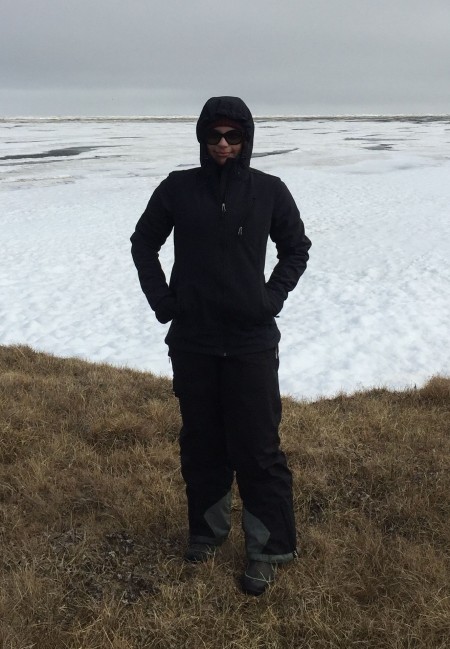
I’ve been involved in launching a big new research project at UTEP focused on critical zone processes in drylands led by my colleague in geology Dr. Lixin Jin. We’re currently recruiting a postdoc to work especially on the eddy flux tower components of the project. I’ll be the main point of contact at UTEP for this part of the project and the postdoc will work with me, but the position is stationed in Boise, Idaho and will also be heavily collaborative with Gerald Flerchinger at USDA, who runs a set of eddy towers associated with the Reynolds Creek site, and Jen Pierce at Boise State. As the ad says, please write an email to all of us if you are interested. It’s a cool project with tons of collaborators and opportunities to get involved with the critical zone research community.

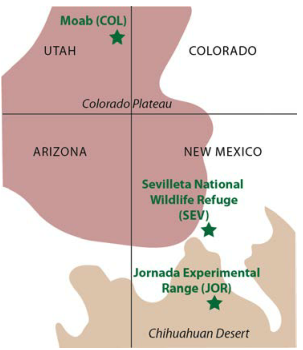
The University of Texas at El Paso (UTEP), in association with Boise State University, and the U.S.D.A. Agricultural Research Service (ARS), is recruiting a postdoctoral researcher to work on a recently funded National Science Foundation ‘Critical Zone Thematic Cluster’ grant to study carbon fluxes, ecohydrology, and nutrient availability in the carbonate-dominated soils of dryland ecosystems. The project has sites in Texas, New Mexico, and Idaho. While funded through UTEP, this position is located in Boise, Idaho and focused on the scientific field operations at the Idaho sites, including the Reynolds Creek Experimental Watershed and the Northwest Irrigation and Soils Research site in Kimberly, Idaho. We are specifically looking for a candidate who has experience working with eddy covariance towers and the data that they generate. Other useful areas of interest include soil science, soil biogeochemistry, knowledge of dryland ecosystem structure and function, and ecosystem-atmosphere gas exchange techniques. We seek a colleague who is interested in collaborative engagement with scientists and students and also in education and outreach activities. Up to four years of funding is available. We will begin to review applications on Nov 15th but the position is open until filled. The target start date for the position is January 4, 2021. For more information, please email Anthony Darrouzet-Nardi (ajdarrouzetnardi@utep.edu), and copy Lixin Jin (ljin2@utep.edu), Jennifer Pierce (jenpierce@boisestate.edu), and Gerald Flerchinger (gerald.flerchinger@usda.gov). To submit an application, please visit this link and send one pdf file with a cover letter, CV, and contact information of at least three referees.

That link at the bottom is to the official listing on the UTEP HR site. If you have any issues, try clicking it a couple times. The system can be a bit clunky.


Comments Off on Postdoctoral position studying critical zone processes in drylands
Early snowmelt project summary bibliography

December 9, 2019 – 2:44 pm

Image

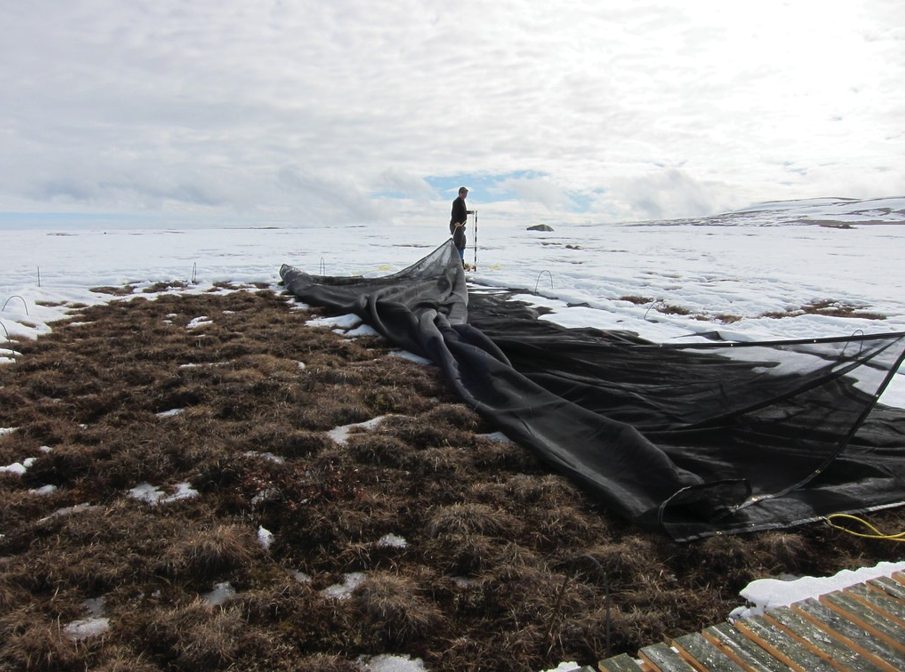
Today at AGU I’m doing a synthesis of the results of our 2010-2012 snowmelt experiment. Here’s a quick bibliography of the project papers.

Belowground responses
Darrouzet-Nardi, A., H. Steltzer, P. F. Sullivan, A. Segal, A. M. Koltz, C. Livensperger, J. P. Schimel, and M. N. Weintraub. 2019. Limited effects of early snowmelt on plants, decomposers, and soil nutrients in Arctic tundra soils. Ecology and Evolution 9:1820-1844.

2012 aboveground plant responses
Livensperger, C., H. Steltzer, A. Darrouzet-Nardi, P. F. Sullivan, M. Wallenstein, and M. N. Weintraub. 2016. Earlier snowmelt and warming lead to earlier but not necessarily more plant growth. AoB Plants 8.

Senescence
Livensperger, C., H. Steltzer, A. Darrouzet-Nardi, P. F. Sullivan, M. Wallenstein, and M. N. Weintraub. 2019. Experimentally warmer and drier conditions in an Arctic plant community reveal microclimatic controls on senescence. Ecosphere 10:e02677.

Soil cores vs. lysimetry
Darrouzet-Nardi, A., and M. N. Weintraub. 2014. Evidence for spatially inaccessible labile N from a comparison of soil core extractions and soil pore water lysimetry. Soil Biology and Biochemistry 73:22-32.

Microplate amino acid assay
Darrouzet-Nardi, A., M. P. Ladd, and M. N. Weintraub. 2013. Fluorescent microplate analysis of amino acids and other primary amines in soils. Soil Biology and Biochemistry 57:78-82.

Theoretical soil pore water N dynamics
McLaren, J. R., A. Darrouzet-Nardi, M. N. Weintraub, and L. Gough. 2017. Seasonal patterns of soil nitrogen availability in moist acidic tundra. Arctic Science 4:98-109.

N limitation
Melle, C., M. Wallenstein, A. Darrouzet-Nardi, and M. N. Weintraub. 2015. Microbial activity is not always limited by nitrogen in Arctic tundra soils. Soil Biology and Biochemistry 90:52-61.


Comments Off on Early snowmelt project summary bibliography

The percent difference fallacy and a solution: the ratio t-test

September 12, 2018 – 12:26 pm

One of the most common forms of statistical malpractice I see as a reviewer and reader of scientific literature is using a null hypothesis statistical test (NHST) to declare an effect “significant” and then using this as justification for reporting completely unqualified percentage differences among treatments with no attempt to deal with the associated uncertainty. We might call this the percent difference fallacy.

It’s as if when p < 0.05 is achieved, suddenly our estimates of percent difference among treatments are accurate to 2-4 significant digits! Here’s an example I came across in a recent issue of Ecology.

Survival rates were 20.4% higher in the first cohort compared with the second (historical mean control) cohort (Dunnett’s test, p<0.001)

This is not from an article I would normally read. I just scanned recent articles for about 5 minutes till I found this one, but hopefully now that you know about it, it will annoy you as much as me when you start seeing it everywhere.

While this is not just a significant digits issue, the three digits presented in the above example (20.4%) represent what I think readers will often interpret as vastly better constraint on that value than is warranted. Even if the reader doesn’t interpret it as a value constrained to between 20.35 and 20.45%, I think most readers will underestimate how much greater the uncertainty is in most cases.

I’ll demonstrate with an R example (though you ought to still be able to follow here even if you are not an R user). Let’s say we have two treatments and the actual difference between them is that b is 50% larger than a, and there is some randomly distributed sampling error.

a <- 10 + rnorm(10)
b <- 15 + rnorm(10)
t.test(a,b)

This gives us output similar to the following:

Welch Two Sample t-test
data: a and b
t = -11.37, df = 17.997, p-value = 1.199e-09
alternative hypothesis: true difference in means is not equal to 0
95 percent confidence interval:
-5.783967 -3.979782
sample estimates:
mean of x mean of y
10.05559 14.93747

Ok, so we have an absurdly significant p-value of 0.000000001199! The difference is “real” and percent differences quite accurate we might think to ourselves. So let’s calculate the percent difference: (14.93747-10.05559) / (10.05559) * 100 = 48.54892. Hm, that’s a lot of digits in both cases, so we’ll just report that treatment b is 48.5% higher than treatment a (p < 0.001). Boom, quantitative analysis is complete.

But wait, wasn’t that difference supposed to be 50%? It was. And we got somewhere between 48 and 49% which is, let’s call it, “off by a bit” when we use the easy-on-the-eyes three significant digits system and these particular parameters. Keep in mind that in many studies, especially in ecology, variation is higher and sample sizes lower (in other words, not all p-values are 0.000000001199).

So this leads to a question: is there a good way to quantify this uncertainty that we are seeing in these percent differences? And it turns out for a simple problem like this that there is.

We can do a “ratio t-test” in which we take the logs of the data, run a t-test, and then un-log the values. Meta-analysis practitioners who want to synthesize a lot of treatment/control ratios often take advantage of this situation where the difference in the log values is related to the quotient of the un-logged values.

t.test(log(b), log(a))

Welch Two Sample t-test
data: log(b) and log(a)
t = 11.022, df = 16.039, p-value = 6.801e-09
alternative hypothesis: true difference in means is not equal to 0
95 percent confidence interval:
0.3213321 0.4743339
sample estimates:
mean of x mean of y
2.701976 2.304143

Then we un-log and we can get a confidence interval for our percent difference

exp(2.701976 - 2.304143) = 1.488595
exp(0.3213321) = 1.378963
exp(0.4743339) = 1.606943

So, that 1.488595 looks familiar, it’s close to the 48.5% we calculated before. Why is it not exactly the same? Idunno and someone that is better than math and stats and R inner workings that me can figure that out, but you’ll find it’s always really close like this.

More interesting though is the 95% confidence interval: 37.8% to 60.7%. Pretty big! That third significant digit is starting to look ridiculous with what we now see is more of a 20% window. I would bet most scientists doing this type of analysis would not think it was so large when the p-value was so small. But it is, and we can demonstrate with 10,000 simulations:

set.seed(1)
ans <- logical(10000)
for(x in 1:10000) {
a <- rnorm(10) + 10
b <- rnorm(10) + 15
m <- t.test(log(b), log(a))
lwr <- exp(m$conf.int[1])
upr <- exp(m$conf.int[2])
ans[x] <- lwr < 1.5 & upr > 1.5}
summary(ans)

This gives 473 FALSE to 9527 TRUE, which is what we expect with a 95% confidence interval. Try it with other seeds, you’ll get the same answer. This shows that the ratio t-test confidence intervals (e.g., the 48.8% [37.8%, 60.7%] from above) are correct. And thus it follows that even if you have a ludicrously low p-value, you CANNOT assume or fairly present a percentage difference with 2 or 3 significant digits and no estimate of uncertainty. And remember if you see a p-value that is a lot closer to 0.05, that interval is probably something like 48.8% [1%, 90%]. In my view, scientists must start presenting these intervals done by ratio t-tests or similar approaches to avoid the percent difference fallacy.


Comments Off on The percent difference fallacy and a solution: the ratio t-test

More CO2 fluxes in biocrusted soils

August 16, 2018 – 6:21 pm

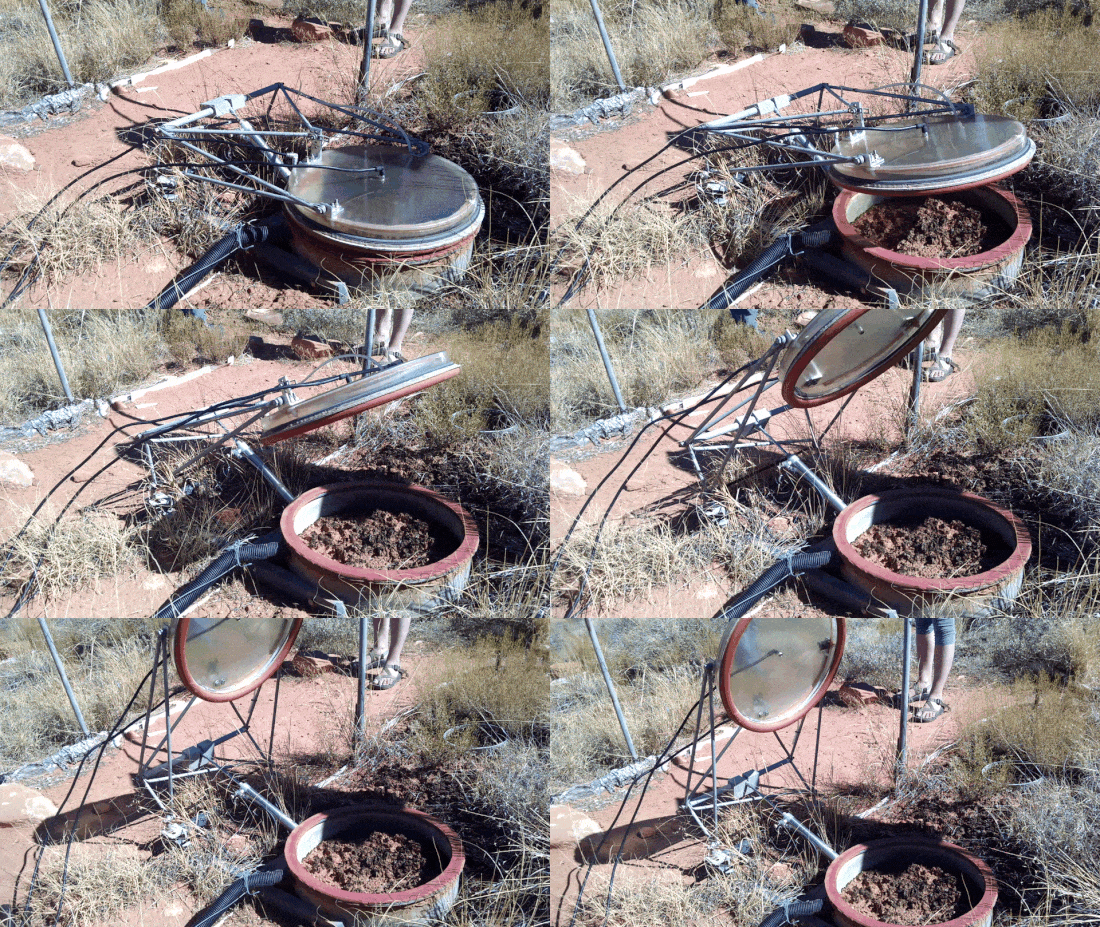
We have a new paper out on CO2 fluxes in biocrusted soils. The experiment takes advantage of a unique automated CO2 chamber system inside of a climate change manipulation. Using clear lids as seen below, can monitor photosynthetic uptake from biocrusts as well as CO2 efflux from both the biocrusts and the underlying soils.

In the first study, we explored the early effects of an infrared-lamp induced warming treatment and looked at correlations between fluxes and environmental variables. One of the cool things we saw was that crusts actively photosynthesized a lot in the winter, including under snow.

In this study we both add data on the other treatment in the experiment, a water treatment, as well as examined the experiment nine years later. A few things had changed about how the treatments were implemented but together the data show how long term effects can change over time. We also saw some interesting interannual variation that I believe is linked to plant effects.

I think in these chambers the effect of root respiration is actually pretty big, even though the chamber walls go down 30 cm. The roots of desert plants are just pretty enterprising when it comes to finding unexplored volumes of soil where they might be able to get water and nutrients.

Here’s the big summary of all the years that shows how the biocrusted soils in these different treatments exchange CO2 over time.

It was a fun study to work on, I was really pleased with the papers that ended up coming together, and I’m excited to be working on making a similar chamber system to study fluxes in the Chihuahuan desert.


Comments Off on More CO2 fluxes in biocrusted soils

Dryland biogeochemistry interview on Science Moab

June 4, 2018 – 12:50 pm

Just a quick post to share this cool interview of me done by my graduate student Kristina Young. She has quite the talent for putting together these podcasts and I am well on my way to listening through all of the neat episodes.

The thing that is really neat about the show is that because Kristina understands the science herself, she knows what questions to ask to get her interviewees excited to talk about the things they are studying. I’ve learned all sorts of stuff listening to various episodes like that restoring plants as locally and site-specifically as possible is the way to go, and that mammals are really the only vertebrates who take chewing their food seriously. These are the type of fun facts I love to share with my introductory biology students, which I will surely do! It’s a great show, check it out.


Comments Off on Dryland biogeochemistry interview on Science Moab

A short reflection on 10 years of blogging

May 21, 2018 – 1:33 pm

The blog has been down for a while due to technical difficulties but I’m now thrilled to have it back up and running. It’s previous home, The Artifex, a homegrown server run by my good friend Hunter Blanks had to move on from being able to support a WordPress blog. I am most grateful to Hunter for being generous enough to host it there for its first 10 years! The main issue was security concerns, which was also a roadblock when I looked into having the blog hosted at UTEP. I guess WordPress security is a hassle and no one wants to deal with it! Fortunately I’ve found an affordable third party host that’s working well and has provided good customer service to boot. I think of the internet as having an unforgiving permanence to it, but apparently this is not so for dynamically generated content like a WordPress blog. One day I’d like to make sure to archive everything in a more permanent way.

Here’s my thoughts on doing occasional blogging over a 10-year period. When people ask about it, the first thing I tell them is that it’s a lot of work! Writing a decent post requires some effort and several rounds of self-editing if you don’t want it to suck. It’s not like facebook or twitter or reddit where you can crank out a first draft of your thoughts and it’s fine and it’s no work and it fits right in (at least I can’t do that). Blogs need more thought behind them, which is a strength of the medium. Weirdly for me, I feel like I’ve now seen blogs come and go as a trend on the internet, though I think they will always have their niche as an intermediate type of content somewhere between the level of polish seen on stream of consciousness social media and more formal publication media like scientific journals or journalism outlets.

One thing I like about blogs is being able to edit old content. I can always go back and change an awkward sentence or a factual error or a bad joke and the next person who finds that post won’t be subjected to it. In fact in having to go back and correct some hyperlinks with this new home for the blog, I fixed a few of these sorts of things. Although blogging is a real time commitment and I have to be careful with time allocation for any project in my job, I’m looking forward to sharing some new thoughts here on the usual topics of ecology and statistics, as well as some ideas on teaching, which is something I now have a few years experience doing here at UTEP. And so with that, onward to the next 10 years of Anthony’s Science Blog!


Comments Off on A short reflection on 10 years of blogging

Critical Zone and Soil Ecology meetings

June 9, 2017 – 4:06 pm

I went to two different conferences this week, the Critical Zone Observatory (CZO) all-hands meeting and the Soil Ecology Society (SES) Meeting. It was an amazing and jam-packed week of science, I learned a ton, and it was fun to compare and contrast these two communities. I presented a poster on some of our work on Chihuahuan Desert soil and microbial processes in a poster at the CZO meeting and I presented a talk synthesizing some of the work I’ve done on soil pore water in Arctic systems at SES. CZO is more geo and SES is more bio, but one clear conclusion from this week is that people in both communities would be fascinated by what scientists in the other are up to.

I was excited to attend the CZO meeting because I have long been involved in the LTER network and have been aware of CZO but had not seen a lot of CZO results up close. The community is impressively developed, with around 200 scientists attending the meeting and something like 500 researchers across all career levels in the whole network. It’s becoming an essential part of our nation’s science infrastructure. There was discussion of topics such as major findings from the CZO sites, the future of the CZO program, and its relationship to other environmental observing networks.

There was some debate about exactly what the boundaries of the “critical zone” are, though there was also quite a bit of consensus that it’s roughly something like canopy to bedrock. Peter Groffman (who by the way is a fantastic scientist and nice guy who without fail stops by my talks and posters to give me smart feedback about whatever I’m working on) made a great observation in his talk that the environmental and Earth sciences are now in the era of “network science.” I would have to agree with this assessment what with LTER, NEON, CZO, and many other environmental research networks continuing to grow and mature, not to mention distributed experiments like NutNet, WaRM, DIRT, and BIODESERT.

Some of the talks that were highlights to me were Susan Brantley’s plenary, Steve Holbrook’s talk on geophysical measurements, Daniella Rempe’s talk on “rock moisture” at the Eel River, and Emma Aronson’s soil microbial work at various CZO sites. Brantley’s talk emphasized the value of the CZO endeavor in informing crucial questions of interest to our civilization such as the environmental impacts of fracking. She also summarized a bunch of the coolest findings from across the different CZO sites. Holbrook’s geophysics team’s ability to “see” belowground features such as porosity and depth of various parts of the critical zone was amazing. One technique they used apparently involves whacking the ground with a sledgehammer to follow the seismic waves it creates. I think we can all agree we want to be the sledgehammer guy or gal. Rempe’s talk was cool because it showed how we are beginning to crack the mystery of how water interacts with fractured bedrock. I was always told that’s a black box until the water gets to the river. Aronson combined all of my favorite soil measurement techniques (nutrients, enzymes, etc.) with microbial community analyses and was really bringing the biology to the geology and hydrology heavy teams at the CZO.

The CZO network is set apart in a couple ways from LTER, NEON and other networks. It differs from the LTER objective of repeated long-term observation (in part due to the fact that many processes of interest to critcal zone scientists operate over deeper time periods), but similar to LTER the science is hypothesis-driven with questions tailored to specific sites. This sets both LTER and CZO apart from NEON, which is more of a large-scale observation tool with a huge strength being its consistency in methods across sites, a feat neither LTER nor CZO attempt at nearly the same degree. There were some good discussions at the meeting of how to integrate these different networks and I noticed that there is a fair amount of interest both from the community and from NSF to do this when warranted to answer ambitious questions. Overall, the CZO network has been really successful in bringing together lots of researchers to understand soil, ecosystem, and geologic processes. I give them an A+.

Wow, I had quite a bit to say about that meeting. Thanks for continuing to read! I will now forge ahead with my thoughts on the Soil Ecology Society Meeting.

I arrived at the Soil Ecology Society meeting on Wednesday morning, just in time to catch the end of the “Ecology of Soil Health Summit.” The current president of the Soil Ecology Society, Matt Wallenstein spearheaded this effort to bring together agricultural and industry folks with us soil ecologists. It looked to me like a big success and there is no doubt that all sides have a ton to learn from each other. I also really enjoyed getting to talk to Matt about his growing startup company Growcentia, which is now turning a profit selling their signature product “Mammoth P” primarily to Cannabis growers (though strawberry and tomato growers too they assured us!). It’s an amazing accomplishment for an ecologist like Matt to turn into a successful entrepreneur and the perfect demonstration of how decades of basic research in a field like soil ecology can all of a sudden be harnessed to drive our nation’s economy forward.

After the conclusion of the Soil Health Summit that morning, the “soil nerds” as we were called by one presenter (who to be fair is an insect nerd herself, my good friend, and now CNN personality Jane Zelikova) were unleashed. These are pretty much “my people” when it comes to science so it was a great pleasure to see all of their latest greatest findings.

Some talks that were highlights for me were Stuart Grandy’s talk on his new approaches to studying the nitrogen cycle, my postdoc advisor Mike Weintraub’s work building on our studies of soil pore water, and Kirsten Hofmockel’s talk on comparing cropping techniques in Iowa with respect to soil sustainability. Stuart is pushing our understanding of the nitrogen cycle backwards from the production of inorganic N in soils to better understand the process of depolymerization of the organic compounds that yield amino acids and other N-containing monomers. His approach includes an awesome sounding setup for doing 15N amino acid pool dilutions. Mike presented some data from deciduous forests in the Stranahan Aroboretum in Toledo testing to see they saw the same seasonal trends in soil pore water sugars that we had seen in the Arctic. He didn’t, but hey that’s research, especially in soils.

Finally, Kirsten’s talk had some shocking images showing for example corn being grown directly on a riverbank. This may not sound shocking but there were audible gasps from biogeochemists in the audience who understand the importance of denitrification-stimulating riparian buffer zones as a crucial stopgap to the so-called “nitrogen cascade” of environmental impacts caused by our overuse of N. Anyway, it was a great talk designed to show us how we can take advantage of soil ecology to inform cropping practices that maintain higher microbial biomass, soil fertility, and ultimately make farming more sustainable. I also always enjoy seeing the soil science being done at PNNL where Kirsten is the Lead Scientist for Integrative Research. Comparing their cutting edge analytical capabilities vs. average soil scientists like me is IMAX vs. VHS. (I note though many movies can still be appreciated without IMAX!)

All in all a great soil adventure. I look forward to heading home, seeing the kids, and jumping head first back into understanding tundra and desert soils next week.


Comments Off on Critical Zone and Soil Ecology meetings

Biogeochemistry on the Range

December 6, 2016 – 6:33 pm

A couple months ago, I wrote a fun short essay for the Bulletin of the Ecological Society of America about a paper that helped to shape my thinking in Ecology. I chose a paper by renowned biogeochemist Bill Schlesinger and Bill in turn wrote a response describing what had influenced him to work in the same ecosystem I’m now studying, the Chihuahuan Desert at the Jornada Experimental Range. It was fun to do and the whole series of these articles called Paper Trails are fun to read. I’m grateful to Bulletin editor Steve Young for inviting me to do this.

Image


Comments Off on Biogeochemistry on the Range

Biocrust3

October 3, 2016 – 1:04 pm

I had the pleasure of attending the Biocrust3 conference this week organized by Matt Bowker and my former postdoc advisor Sasha Reed. I shared data from our automated CO2 chambers that are set up in a climate change experiment outside of Moab, focusing on reiterating some of the results of our published study and presenting some fun new data as well. The automated chamber system, constructed and maintained by Ed Grote and overseen by Jayne Belnap and Sasha Reed has provided an unprecedented view of C balance in biocrust-dominated systems, and I tried to share some of my enthusiasm for the approach during my talk at the meeting.

Dr. Jayne Belnap, the world’s foremost expert on biological soil crusts, sharing some of her favorite crusts.

Besides getting the chance to share some of my work with the perfect audience, some of the other highlights of the conference included an overview of the new edition of the definitive reference on biocrusts, Biological Soil Crusts: An Organizing Principle in Drylands by its lead editor Bettina Weber; a retrospective by Jayne Belnap on her inspiring career devoted to studying biocrusts; and a large number of students and other early career scientists presenting an impressive array of cutting edge approaches to the next generation of biocrust research. One especially fun talk was by Tadd Truscott, the PI of the “splash lab” on the microscopic adaptations to water uptake in the common biocrust moss Syntrichia caninervis. The other plenary talks were also top notch, including Fernando Maestre’s work on biocrusts and distributed dryland experiments, and Trent Northen’s talk on omics approaches to biocrusts and other soil ecosystems.

A closeup of Syntrichia from the Splash Lab.

With 150 attendees, it’s obvious that biocrust research has recently grown in volume and scope. Biocrust3 highlighted several areas in which amazing progress is being made. These areas included genetic analyses of cyanobacteria and other biocrust components, a huge push toward understanding biocrust restoration, and a deepening understanding of the identities and functional purposes of the diverse components–cyanobacteria, heterotrophic bacteria, fungi, algae, mosses, lichens, and more. Leading the pack here was our postdoc for the fungal loop project Eva Dettweiler-Robinson who presented findings from her fungal loop work that has laid the foundation for our new project on the topic.

Our team checking out plants and biocrusts at Sand Flats

Perhaps the most fun part of the conference for me was that it was a chance for a team that we have been assembling for our fungal loop project to come together for the first time. Through shared lodging and several field expeditions this week, we had a chance to get to know each other as well as scope sites for the project and scheme and plot about the discoveries we want to work toward. I sense that this is the kind of team that will be able to not only accomplish our project objectives but take on a life of its own. See you at Biocrust4!

2 Comments »

Summer 2016

August 9, 2016 – 4:00 pm

It’s been a busy summer in the Darrouzet-Nardi lab. We have been revving up a large number of projects. The biggest one is the fungal loop project looking at materials exchange between plants and biocrusts. We’ve run some test runs for our isotopic tracer experiment at both the Jornada and the Sevilleta and we’ve also been working on some cool translocation clues from natural abundance 13C data, spearheaded by our awesome soon-to-be postdoc Eva Dettweiler-Robinson. An REU student, Isabel Siles Asaff, has been doing some great work on how plant and soil water potential may help to control translocation.

Eva (right) and incoming fungal loop grad student Grace Crain working on some raceways

Isabel and Jimmy working on plant-soil-biocrust water relations.

On another project, master’s student Alex Lara has been working on building automated CO2 flux chambers that we are going to deploy at The Jornada at a site with an eddy flux tower run by my UTEP colleague Craig Tweedie.

Alex with his sweet chamber prototype

My first Ph.D. student Jane Martinez spent the summer up in the Arctic, mostly in Barrow, and also in association with one of Craig’s projects. She is bringing back boatloads of soil cores that we are going to use to take the plunge into some proteomics. Wish us luck!

Jane in the Arctic, looking chilly yet snug

A brand new Ph.D. student starting this fall, Shani Rivera, has been working on setting up sites for an international project, BIODESERT, run by Fernando Maestre in Spain. BIODESERT investigates the role of grazing on plant and soil properties in drylands around the world. I think they said they now have sites in something like 29 countries, which is amazing. We are really excited to be part of such a huge and neat collaborative project. Here’s a picture from one of Shani’s sites.
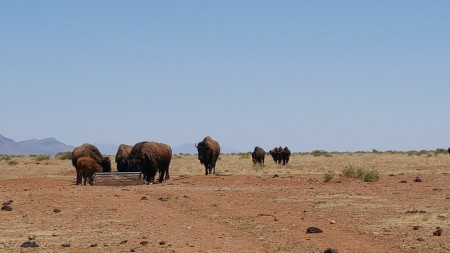
Bison at the Janos Biosphere Reserve in Chihuahua, Mexico

My UTEP colleague (and basically partner in crime at this point) Jennie McLaren and I co-advised two REU students, Shyla Cooks and Xavier Soto, who were looking at soil properties from a series of plots set up by Brandon Bestelmeyer, a collaborator from USDA/NMSU/The Jornada LTER. These plots were part of the Restore New Mexico project that seeks to restore grasslands in New Mexico by reducing shrub cover with herbicides. We are looking at what factors might help predict the success of the herbicide treatments. They had an eventful field season, with weeks of 100+ temperatures, run-ins with livestock, and a getting a vehicle stuck in a wash.

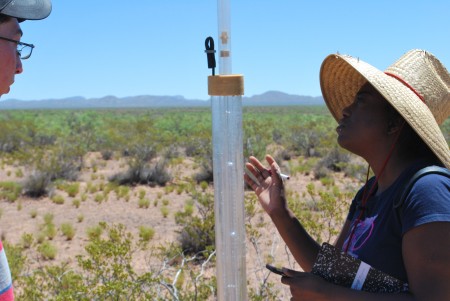
Shyla and Xavier measuring soil hydraulic conductivity. (Also our spare straw hat makes its third appearance!)

Finally, I had two more excellent undergrads working in my lab this summer, Jaime Morales and Daniela Aguirre, who helped with all of the above projects in addition to a few others. Jimmy has become pretty handy with a Licor 6400 and has helped to measure photosynthesis on some greenhouse experiments here on campus in collaboration with some students from the chemistry department. Dani has developed some excellent bench chemistry skills and has been running a ton of microplates, including some I think pretty novel data on soil pore water from microlysimeters in semiarid soils.

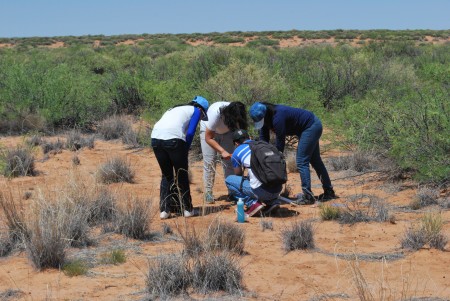
REU students hard at work corin’ soils

It’s been a great summer. I’m so grateful for all of the great work that has gone in to getting the lab off the ground.


Comments Off on Summer 2016

Fun radio spot on our lab research and the fungal loop project

April 20, 2016 – 4:31 pm

Thanks to Andrew Durso of Utah Public Radio for doing this interview with me. Listen here!


Comments Off on Fun radio spot on our lab research and the fungal loop project

Fungal loop site selection

April 4, 2016 – 7:16 pm

I had a great day a couple weeks ago scoping sites on the Jornada Experimental Range. John Anderson, the site manager for the Jornada, gave us the grand tour of areas that had good biocrusts and areas that had some of the plants that we considered targeting. We had great weather and were really able to benefit from his expert knowledge of all of the plants and all of the experiments that have been set up there over the years. It’s a wonderful site to have near us at UTEP.

The picture above shows Eva wetting up some crusts to see what they do! One interesting thing we learned is that there has been a recent convergence of interest in biocrusts at the Jornada, with now three big projects, one focused on biocrust restoration, one focused on examining biocrust effects on soil stability, and our study of translocation between biocrusts and plants. We are hoping to be able to share insights and findings with these groups and gain an unprecedented look at the role of this component of the Jornada site.


Comments Off on Fungal loop site selection

Ph.D. opportunity studying desert ecology in the Southwest

January 20, 2016 – 1:37 pm

Here’s the ad for the Ph.D. positions in my lab. I really think this will be a cool opportunity for a couple of aspiring scientists so please contact me if you’re interested! Please note that though the application date for the UTEP graduate program has technically past, I can still accept applications without issue.

The Darrouzet-Nardi lab at the University of Texas at El Paso (UTEP) is recruiting two Ph.D. students to work on a recently funded NSF grant to study interactions among plants, biocrusts, and fungi in the deserts of the Southwestern United States. Three years of full funding (RA support including summers, project supplies, and travel costs) is available. In addition to joining our growing ecology program at UTEP, students will have the opportunity interact extensively with leading ecologists at both the University of New Mexico and the U.S. Geological Survey in Moab, Utah. The main goal of the project is to test the “fungal loop hypothesis” using isotopic and other biogeochemical techniques. More info on the project goals here. Students will have the opportunity to work at three desert field sites: the Jornada Experimental Range in New Mexico, the Sevilleta National Wildlife Refuge in New Mexico, and a site on the Colorado Plateau near Moab, Utah. The ideal candidate would have some research experience, a published paper from work in any discipline as an undergraduate or M.S. student, strong performance in science courses, and a desire to do field work. Though initially students will work with our team on grant objectives, they will also have considerable opportunity to springboard into projects of their own design. If you love deserts and science, this is a fantastic Ph.D. opportunity. Contact anthonydn@utep.edu if you are interested or have questions.

Field site near Moab for a similar biocrust project


Comments Off on Ph.D. opportunity studying desert ecology in the Southwest

Testing the fungal loop hypothesis for C and N cycling in dryland ecosystems

January 19, 2016 – 12:46 pm

I just wanted to share a more detailed description of our recently funded project for prospective students and anyone else who is interested. This description is similar to NSF’s public abstracts, the first paragraph being for a general audience, and the second more technical for biologists. A key objective of the project is to create a lot of fun opportunities for students at all stages to get involved with Southwestern desert ecology. If you are one of those prospective students, please contact me!


Testing the fungal loop hypothesis for C and N cycling in dryland ecosystems

Understanding the basic biotic relationships and exchanges of energy and nutrients among desert organisms is important because drylands cover about 40% of Earth’s surface and play essential roles in global change phenomena such as rising atmospheric CO2, warming, and dust deposition. Recent evidence suggests that fungi play a critical role in supporting arid ecosystems. Fungi scavenge for nutrients and transport them throughout the soil using their filamentous root-like structures known as hyphae. Fungi may be especially important in areas with extensive biological soil crusts (biocrusts), which consist of surface-layer bacteria, fungi, lichens, and mosses. Biocrusts are common in drylands and confer benefits such as greater soil fertility (some are photosynthetic, turning atmospheric carbon into usable sugars and some can fix nitrogen from the air into forms usable by plants and other organisms) and stability, but how they interact with the dominant plants and how fungi mediate this interaction is not well resolved. This project explores the “fungal loop hypothesis,” which posits that fungal hyphae form a bridge between plants and biocrusts and transport resource such as water and nutrients between plant and biocrusts, conserving the scarce resources. While studies of fungal physiology, genetics, and nutrient cycling have provided support for the fungal loop hypothesis, no comprehensive studies have examined the importance of the fungal loop across multiple dryland sites. To test its importance, researchers on this project will study three different deserts: the Chihuahuan desert near El Paso, TX, the Colorado Plateau near Moab, UT and a site between those, the Sevilleta National Wildlife Refuge near Socorro, NM across three different years and two seasons. At these sites, they will quantify the movement of resources through fungal hyphae and develop a framework for understanding where and when the fungal loop is most important. If the broad importance of the fungal loop can be demonstrated, it will represent a fundamental difference between drylands and wetter environments, and lead to a new understanding of what drives ecosystem processes in drylands.
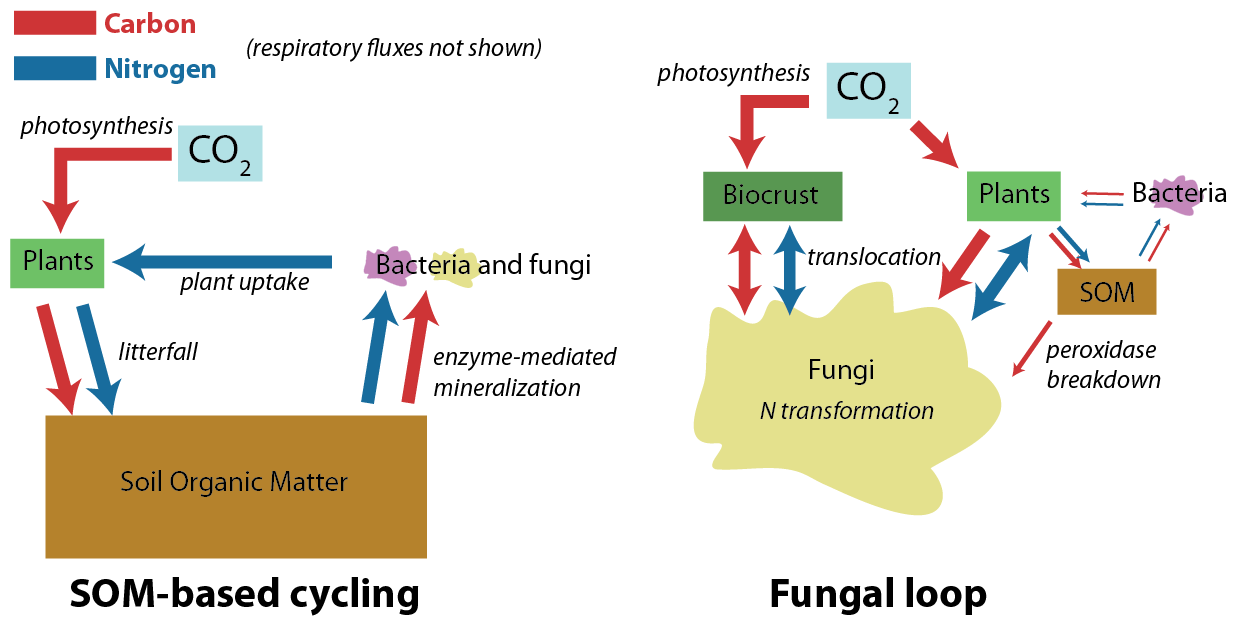
The overall objective of this study is to test the fungal loop hypothesis by studying C and N translocation and retention across representative dryland sites. Using a set of field experiments at three sites, this project will address three questions: (1) How do translocation rates (i.e. transfer of C and N between plants and biocrusts through fungal hyphae) vary among dryland sites, plant and biocrust types, and seasons? (2) Does translocation improve growth, productivity and retention of C and N for plants and biocrusts? And (3) Are translocation rates determined by the stoichiometric requirements of plants and biocrusts? The proposed work will generate a predictive framework for when and where translocation of C and N between plants and biocrusts is greatest by examining translocation rates using isotopic tracers in sites across a latitudinal gradient with multiple biomes, a variety of plant and biocrust functional groups (eg. C3 and C4 grasses, forbs; light cyanobacterial vs. dark, multi-species communities) and different  seasons (spring and monsoonal growing seasons). The work will also examine the importance of translocation by experimentally severing hyphal connections and measuring the effects on plant and biocrust performance as well as retention of C and N in the ecosystem. Finally, to address the mechanism of translocation, the investigators will test the hypothesis that stoichiometric gradients drive C and N movement through fungal hyphae (see figure above) by experimentally manipulating C and N gradients and observing the effects on the horizontal movement of C and N through the soil, also with the use of isotopic tracers. This research approach will allow for an unprecedented evaluation of the extent to which fungi are the key regulators of C and N cycling in dryland soils as suggested by the fungal loop hypothesis.


Comments Off on Testing the fungal loop hypothesis for C and N cycling in dryland ecosystems

Subnivean photosynthesis, warming effects, and more cool findings for biological soil crusts

December 3, 2015 – 5:06 pm

Just before starting my current position at UTEP, I was at USGS in Moab as a postdoc for about a year and a half. Most of that time was spent working on a fascinating data set that came from a large warming experiment set up in the red rock desert of southeast Utah at a site thick with gorgeous biological soil crusts (biocrusts). I was working with my postdoc advisers Dr. Sasha Reed and Dr. Jayne Belnap, who set up the project, as well as USGS scientist Ed Grote, who was crucial to the technical aspects of the operation for the entire length of the study.

Here’s the paper, which came out in Biogeochemistry last week. The main purpose of the study was to examine the effect of the warming treatment on C exchange in these biological soil crust dominated soils. I think the findings for the crusts themselves was pretty clear. We saw that when they were active, that is when the soils were wet enough for the crusts to be photosynthesizing (~10% of the time), the warming treatment negatively affected the carbon balance (denoted as net soil exchange or ‘NSE’ here) in these soils. The warmed soils lost more or gained less carbon than the control soils.

This overall trend was noisier when we looked at the entire year, and I believe this is because we saw high CO2 loss rates in the spring. The source of these CO2 losses is unclear. Here is the yearly trend in CO2 flux:

and here is a graphic I made for an associated presentation indicating the possible sources of CO2.

The interesting thing to note here is that the soils are losing CO2 almost all of the time, which means that the CO2 source cannot come purely from the biocrusts (otherwise they would rapidly disappear from constantly losing C). In the supplemental material, we discuss how we consider the likely sources aside from biocrusts to be (1) sub-crust microbes (2) vascular plant roots and (3) pedogenic carbonates, which would be an interesting inorganic source. My best current guess is that the carbonates are not a big contributor to the annual CO2 fluxes at this site, but honestly it hasn’t been thoroughly studied enough and I think there is a lot more to know about how this inorganic pool interacts with CO2 from plant roots and microbes. Deserts have a huge quantity of inorganic carbon and if even a fraction of it is being actively exchanged it could be a big deal.

Perhaps the coolest thing we saw from taking an exceptionally close look at the high-resolution CO2 exchange numbers was that the biological soil crusts appear to be photosynthesizing under the snow. Check out this event from March of 2006:

The upper part of the graph shows CO2 exchange, with photosynthesis occurring when the points drop below zero (highlighted in green). Precipitation and temperature are shown on the bottom. Here’s a picture of what this precipitation event looked like:

I want to take some biocrusts into the lab and prove that this occurring and explore the dynamics a bit more, but for now this is some intriguing evidence!

The last contribution I want to mention about this paper is the gap-filling techniques that we employed. I used a super cool R package called missForest which iteratively fits random forest models to fill in all gaps in a data set. You can feed it any data frame and it will do its best to fill in the blanks. Its best can be surprisingly good, and I’ve been joking that I’m now very good at creating fake data.

I found I got the most impressive results when I fed it three days worth of time lags on either end of the missing data point. The flux from yesterday at noon is a great predictor of the flux today or tomorrow at noon. This technique worked great for all of the smaller gaps, and is less good for larger gaps, but we were blessed with a relatively complete flux data set compared to many. That’s a testament to Ed and his team keeping the system up. Anyway, if you want more info on this technique, you can see the code for yourself in the supplement and I’d also be happy to answer questions.


Comments Off on Subnivean photosynthesis, warming effects, and more cool findings for biological soil crusts

Explaining p-values intuitively

November 25, 2015 – 10:11 am

There is an interesting post on 538 today showing that most scientists cannot explain intuitively what a p-value really tells you. This does not surprise me, but may surprise some who still think p-values are an acceptable analysis framework. Some can spout the definition but the definition is pretty useless because it relies on epistemologically problematic ideas like separating events into black and white categories of “due to random chance” or “not due to random chance.”

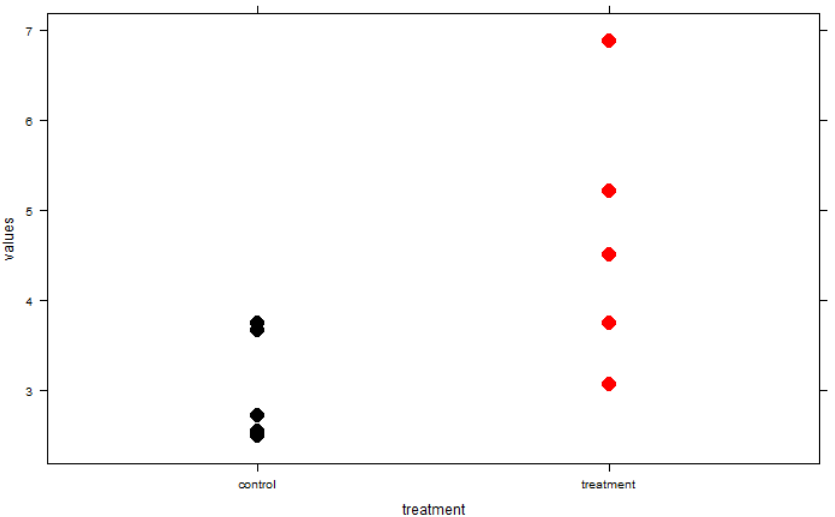
That said p-values are not devoid of information and the way to interpret them is to imagine what they show about a confidence interval. If your p-value is exactly equal to 0.05, your 95% confidence interval for the parameter of interest will exactly touch zero on one end (or whatever your “null hypothesized” value is). Here’s an example of a t-test where p is really close to 0.05. Note the very close link between the p-value being just under 0.05 (yay, it’s “significant!”) and the confidence interval being barely constrained to not crossing zero. The data underlying this particular test is shown in the graph.

Image

So, the p-value is useful insofar as it gives you a clue about what the confidence interval is for your effect size. Confidence intervals are easily human-understandable (e.g., 95% chance the true value is in this range given assumptions of calculation method) while p-values are not. Why not just report the confidence interval instead? That is a rhetorical question.

To get a better sense of p-values for yourself, here’s some code you can fiddle with. Watch the confidence interval and p-value output from the t-test alongside the graph while tweaking the sample size, variability, and true difference between samples. It would be cool to make this runnable and tweakable right here on the website but that’s maybe a project for another day.

n = 5 # sample size
sd = 1 # variability
con <- rnorm(n, sd=sd) + 3
trt <- rnorm(n, sd=sd) + 5 # true difference is 5-3 = 2
t.test(con, trt, var.equal=T)
d <- data.frame(values=c(con, trt), treatment=
  factor(rep(c("control", "treatment"), ea=n)))
xyplot(values~treatment, d, pch=16, cex=2,
  col = rep(c("black", "red"), ea=n))

This might be made even more clear by looking at a paired or “one sample t-test” type of example where you can literally see that 95/100 of the paired differences from many simulations will be within the confidence interval and that, again, that confidence interval will just barely graze 0 when p=0.05.

Along these lines of asking scientists to explain commonly used statistics, I saw in a stats class the professor ask students to draw a standard deviation on a set of points like the ones in the above graph. (This was a radically different kind of stats class and the first place that clued me in to the problems with the p-value paradigm). It was intriguing and instructive to see how difficult it was to interpret a basic concept like standard deviation intuitively. Not to leave you hanging, ~68% of points should fall within the SD.


Comments Off on Explaining p-values intuitively

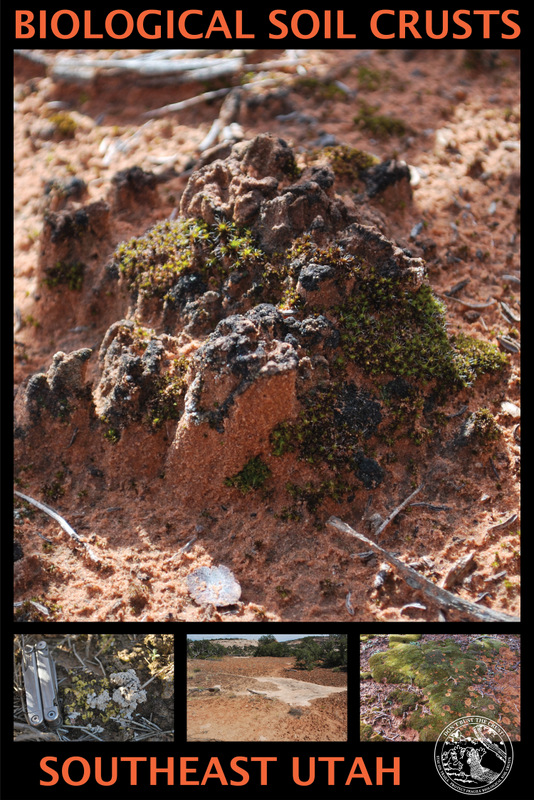
Crust poster

September 18, 2015 – 6:37 pm

I needed to spruce up the bare walls in my office, so I whipped up this crust poster. Fellow crust lovers, if you want one, let me know!


Comments Off on Crust poster

Are new genetics and omics approaches reuniting the field of biology?

June 15, 2015 – 12:04 am

At most large research universities, there are two or more biology departments. At my undergraduate institution UC Berkeley it was Molecular and Cell Biology and Integrative Biology, with many biologists also in the Environmental Science, Policy, and Management Department. At my graduate institution CU Boulder it was Molecular, Cellular, and Developmental Biology and Ecology and Evolutionary Biology. I don’t know the history of these departments, but in some cases I’m sure there were splits, or perhaps in other cases, departments coalesced from older disciplines such as bacteriology and zoology. At my current institution, UTEP, there is still a united Biological Sciences department, which is one of the things that got me thinking about this issue.

Today, these departments are kept apart for a few reasons. First, the gap in the scale of study systems can lead to disinterest in work on the “other side” of biology. If you study plant ecology, its can seem difficult to get anything relevant out of a talk on something like neuroscience. Second, there is a structural difference in funding sources: NIH vs. NSF. If you are doing human biology, you are looking at NIH funding and if you are doing non-human biology, NSF is your go-to agency. The different missions of these agencies are accompanied by cultural differences and career-path differences which can reinforce the gap between molecular/cell biology and ecology/evolutionary biology.

Lately though, I have noticed something interesting happening. As genetic and omics-style techniques become popular in both major branches of biology, the gap between the two biologies has narrowed. Ecologists and evolutionary biologists are reaching for molecular biology and and genetics tools more than ever to understand the underpinnings of non-human organisms and ecosystems. Biomedical researchers are realizing that due to the microbiome, the human body is in fact an ecosystem with phylogenetic diversity, ecological interactions, and the exchange of energy and nutrients among microbes.

Both biologies are making extensive use of omics-style methods. As an ecologist, I am wanting to understand which microbes contain genes that code for key enzymes that break down soil organic matter. I also want to get a better chemical sense of aqueous chemistry in soils, an endeavor that may culminate in metabolomics-type approaches. At the same time that soil ecologists are hunting for genes that control biogeochemical transformations in soils, cancer biologists are replacing an organ and tissue-based system of cancer classification with a system based on gene mutations. Using these gene-based approaches, both groups of biologists are trying to process bigger data sets, and are further tied together by bioinformatics.

To me this convergence of questions and methods is profound in that it underscores the importance of the key tenets in biology. The uniting principle of biology is the evolution of life through natural selection of self-replicating genes that are organized into a diverse suite of organisms. This idea and paradigm is so powerful that it can apparently pull diverging fields of inquiry back together after they have drifted apart.

I’m not arguing that subdisciplines won’t remain distinct, or that these departmental boundaries will disappear, or even that the funding rift is going anywhere anytime soon. However, I do believe that now is a great time to walk across campus and check in with your colleagues in the “other side” of biology.


Comments Off on Are new genetics and omics approaches reuniting the field of biology?

Biogeochemical loops

February 3, 2015 – 5:50 pm

In the early 1980s, advances in analyses of microbial function in ocean water allowed researchers to observe that smaller microbial producers–distinct from well studied photosynthetic dinoflagellates and diatoms–were leaking a substantial amount of dissolved organic carbon (DOC) into the water column. This DOC was then taken up by heterotrophic microbes, who were in turn eaten by phagotrophic protozoa, who were then finally consumed as an additional food source by the primary consumers of the traditional food web. This previously unobserved pathway for transfer of energy and key elements like C and N appeared to operate in parallel to the traditional food web, and was thus named the “microbial loop.” The microbial loop was eventually shown to account for a substantial amount of the C and N cycling and storage in ocean systems, changing our basic understanding of ocean biogeochemistry.

The idea of parallel cycling “loops” has since caught on in biogeochemistry as a way to describe alternative and previously underappreciated cycling pathways. I’ve recently been working with ecologists at the University of New Mexico who have been developing the analogously named “fungal loop hypothesis.” About a decade ago, they began to synthesize evidence suggesting that fungi were an unusually important part of C and N cycling in desert soils. Much like the microbial loop, this non-standard pathway for C and N cycling in soils appeared to represent a fundamentally different cycling pathway in which fungi were key agents of storage, transformation, and translocation for C and N. These functions are normally more closely associated with soil organic matter and heterotrophic bacteria in wetter ecosystems.

I have also heard some rumors that tropical ecologists have been thinking about an alternative “loop” of their own. This makes a lot of sense to me because carbon and nutrient cycling is much more associated with the massive amount of living vegetation in tropical forests than it is in temperate ecosystems. I think this is a really exciting area of biogeochemical theory, with the potential to revolutionize our understanding of how these basic cycles vary among biomes. As more tests of these hypotheses enter our syntheses and the true nature of these alternative loops are understood, we may be partially rewriting and definitely expanding our knowledge of how these key biological elements are cycled in the biosphere.


Comments Off on Biogeochemical loops

Omnibus tests vs. focused contrasts in analyzing experimental data

September 9, 2014 – 4:57 pm

I’ve always been uncomfortable with drawing insights from big complex ANOVA models, and in searching for a couple stats references for a paper, I found there is a sizable literature on the topic.

Here’s a statement from a book by Robert Rosenthal and colleagues that summarizes exactly how I feel about these models:

The problem is that omnibus tests, although they provide some protection for some investigators from the danger of “data mining” when multiple tests are performed as if each were the only one considered, do not usually tell us anything we really want to know.

I like the term “omnibus tests” as a description for these types of analyses that try to arrange all possible variables into a hard-to-interpret statistical model. I find the interpretation of “interaction effects” in many models I see to be particularly problematic.

As an alternative to these omnibus tests, the authors suggest using “focused contrasts,” which to me, sounds very similar to the “lots of t-tests” approach that I have settled on for many of my analyses. In their book, they present some novel algorithmic approaches to making these contrasts, and while I have not read the whole book to understand what they did, I think that the basic concept of learning about data from many simple analyses instead of one kitchen-sink style analysis is the same.

I also think they are correct that fear of errors from multiple comparisons is a big reason people gravitate toward omnibus tests. My feeling is that the epistemelogical challenges that multiple tests can create are better dealt with in the interpretation phase rather than the calculation phase of an analysis.


Comments Off on Omnibus tests vs. focused contrasts in analyzing experimental data

Ocean fertilization: still not recommended

July 8, 2014 – 7:06 pm

The idea of fertilizing the ocean with iron to capture carbon is one of the more colorful ideas to arise directly from a basic understanding of biogeochemistry. Ocean phytoplankton are iron-limited and alleviating that iron limitation makes them grow enough to cause some of the fixed carbon to get locked away in the deep ocean. There was substantial debate about a decade ago about the feasibility of this idea for fighting climate change and I seem to remember that most of the scientists involved decided that it was an interesting but not practical idea.

A re-promotion of the idea was making the internet rounds today due to this profile of a prominent advocate—practicioner even—of iron fertilization. I had forgotten the details of the debate so it was fun to revisit them. The profile is written in such a way to make it seem like iron fertilization is a great idea that is being held back only by environmentalists scared of geo-engineering. Unfortunately for the author–or perhaps to their credit in being objective–the counterarguments to this viewpoint are apparent in the article itself. The author writes:

iron fertilisation could potentially sequester as much as 1 billion metric tons of carbon dioxide annually, and keep it deep in the ocean for centuries. That is slightly more than the CO2 output of the German economy, and roughly one-eighth of humanity’s entire greenhouse gas output.

This sounds good until it is put to a simple cost benefit analysis. The one-eighth figure likely comes from a modeling study, and is also discussed in an editorial in Nature arguing against iron fertilization back in 2009. (I note that the authors here are better described as ‘scientists’ than ‘environmentalists.’ ) In that editorial they write:

A model published in 2008 (K. Zahariev et al. Prog. Oceanogr. 77, 56–82; 2008), which is as convincing as any available, found that even if the entire Southern Ocean were fertilized forever with iron sufficient to eliminate its limitation of phytoplankton production, less than 1 gigatonne of carbon a year of CO2 of probable future emissions (currently about 8 gigatonnes a year) would be sequestered, and that amount for only a few years at best.

So there you have the cost and the benefit. The benefit: we may reduce 1/8th of our emissions, a substantial and impressive amount, but nowhere near enough to stop global warming. The cost: we risk fucking up an entire ocean. The ‘environmentalists’ were ridiculed in the the pro-fertilization piece for having that attitude, but it hardly seems outrageous to worry that fertilizing an entire ocean to stop 1/8th of our emissions could have unintended consequences, and the Nature editorial shows that scientists, myself included feel the same way.

There are too many examples of fragile food webs tied together as trophic cascades and biocontrol agents gone wrong to not worry about unintended consequences of a vast ecological manipulation in a system that is not totally understood. We are still barely getting a handle on the consequences of doubling carbon in the atmosphere. Is it wise to perform a similar experiment with another element in the ocean? The pro-fertilization piece crescendos toward this point at the end:

The ocean is no longer a vast, unknowable wilderness, whose mysterious gods must be placated before it can be crossed. Instead, it’s become the first viable arena for large-scale manipulation of the planetary environment.

What could possibly go wrong?


Comments Off on Ocean fertilization: still not recommended

Carbon cycling in semiarid systems

May 28, 2014 – 5:35 pm

There is a cool new paper in Nature showing that semiarid ecosystems can have big effects on overall carbon concentrations in the global atmosphere, primarily through enhanced productivity of vegetation in wet years. The authors write:

As the dynamics of dryland systems, which cover 45% of the Earth’s land surface, increase in global importance, more research is needed to identify whether enhanced carbon sequestration in wet years is particularly vulnerable to rapid decomposition or loss through fire in subsequent years, and is thus largely transitory. Such behaviour may already be reflected by the larger-than-average atmospheric growth rate in 2012 (ref. 30) that was associated with a return to near-normal terrestrial land sink conditions.

In other words, the next question is how long can these systems lock up this carbon in the transient vegetation of deserts? I would guess that, as the authors suggest, a string of dry years would cause these gains in carbon storage to be lost, but it might take a couple of decades to work the carbon out of the soil, and increased fertility in the short term can lead to soil stabilization, thus increasing overall ecosystem fertility, particularly with good land management practices. So this could be a good thing for the climate, and an essential role played by dryland ecosystems.


Comments Off on Carbon cycling in semiarid systems

Spatially inaccessible soil nitrogen

March 6, 2014 – 4:44 pm

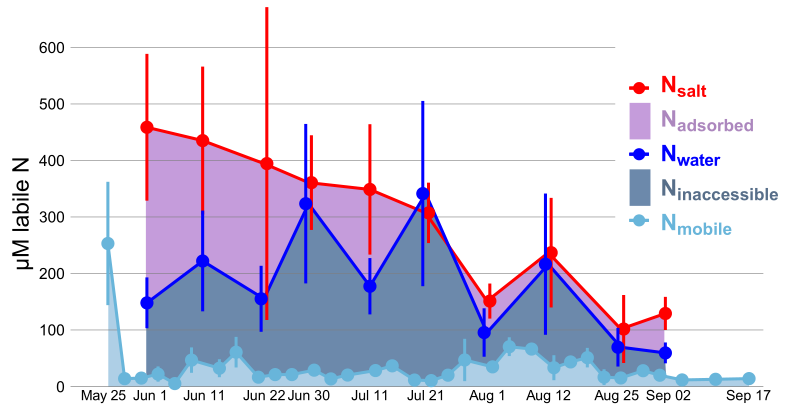
One of Mike’s and my papers just came out this morning in Soil Biology and Biochemistry (link here). We compared nitrogen concentration data from our lysimeter samples of soil pore water and our extracted samples from soil cores and found were were seeing a lot more nitrogen in the soil core samples. This seemed to support the idea from a paper by John and Erik Hobbie a few years ago in which they suggested that soil amino acid concentrations seemed a little too high given the strong uptake capability of microbes, and that thus some of it might not be biologically available. Here’s our key figure showing the relative magnitude of nitrogen pool sizes and suggesting a sizable “inaccessible” pool:

You can see that the cores (red and dark blue lines), even though quite variable, definitely get more nitrogen than the lysimeters (light blue), which spike at the beginning of the season and then drop to low levels. It also looks like the adsorbed pool (mostly ammonium bound to the soil matrix) and the inaccessible pool can change throughout the season, so the inaccessibility isn’t permanent. Overall, a fun comparison of techniques that I think has implications for the way nitrogen is actually cycled in soils.


3 Comments »

Digging deeper into moss death

February 7, 2014 – 4:59 pm

One of the coolest results so far from the global change experiment I’ve been working on is that mosses that are part of the biological soil crusts have pretty much all died in response to the experimental addition of numerous small rainfall events (Reed et al. 2012). The mosses die because they lose more carbon during the small wet-up events than they can gain from photosynthesis during the short time that they are rehydrated. This finding got us curious about the moss physiology and biochemistry behind why they cannot keep up with the carbon demands and what ultimately causes their death.

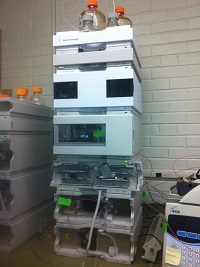
To help answer that question, my postdoc adviser Sasha Reed and I visited the University of Missouri last week where we learned some awesome analytical techniques in Mel Oliver’s lab, particularly from his amazingly skilled postdoc Abou Yobi. These guys are experts in plant biochemistry and we had a lot of great conversations about stress biology and the chromatography techniques (one of their cool HPLC units above) that they are using to measure the key metabolites that govern plant responses to stress.

Many mosses, especially in the desert, are dessication-tolerant, meaning they can completely dehydrate and rehydrate as part of theyr normal physiological function. There is a ton of fascinating biochemistry here, particularly in understanding how the plant cells respond when they dry out and wet up. Plants have two strategies in surviving dessication: protection and repair. In practice, most dessication-tolerant plants are somewhere along this spectrum. They can try to protect their cells in preparation for dessication by resorbing and preserving themselves as best as possible, or they can devote resources to repairing cells and tissues once they rehydrate.

There are a huge number of metabolites, proteins, enzymes, and other compounds that help these mosses perform the amazing feat of surviving total dessication and rehydration. There are compounds that help them resist the osmotic shock of drying out and rewetting–osmoprotectants–such as sucrose and some amino acids. One of the interesting facts we learned is that Syntrichia ruralis, a sister species to the one present in our experiment, S. caninervis, is 10% sucrose by weight when it is dried out. This is the first thing we want to look at in our mosses because if they cannot regenerate those sugars, they may not be able to dry out properly, sustaining damage to their membranes without the sugar to mediate the collapse of cell membranes and organelles.
Image

Other potentially important compounds include antioxidants, photoprotective pigments, and a class of proteins called LEA proteins that can prevent reactive oxygen species (ROS) from building up and damaging cells. Mel and Abou have been using “omics” approaches in which a large number of metabolites (metabolomics), expressed genes (genomics), proteins (proteomics) or other compound classes are measured simultaneously to give a more complete biochemical picture of a plant tissue under conditions such as dessication (example figure above). Perhaps the ultimate way to answer our question would be to use these techniques on mosses over the course of the rapid wet-dry cycles that ultimately result in their death. We won’t go that far at least for now, but it was fascinating to learn what kind of analytical capability is out there. Bringing these types of approaches to global change experiments could be an excellent avenue for future research and collaboration!


Comments Off on Digging deeper into moss death

How much carbon is stored in dryland soils?

November 19, 2013 – 5:00 pm

Drylands are not known for massive soil carbon stocks like the Arctic tundra or plant carbon storage like tropical forests. However, drylands account for a large fraction of the terrestrial surface so they are still important when considering global carbon.

Many drylands biogeochemistry papers include statements like this one:

Arid, semiarid and dry-subhumid ecosystems (drylands) occupy 41% of the terrestrial surface, and account for ca. 25% of global soil organic carbon (C) reserves.

To put those numbers in context using the aridity index≤0.65 definition of drylands (numbers from Millenium Ecosystem Assessment):

Dryland: 41% of terrestrial surface
   Hyperarid: 6.6%
   Arid: 10.6%
   Semiarid: 15.2%
   Dry Subhumid: 8.7%
Frozen ground and Permafrost: 36%
   Ice: 10%
Everything else (mostly forests): (23%)
   Tropical Forests: 5% (used to be 2x more!)
All forests (overlaps with other categories, particularly boreal forest): 28%

When you follow the references back to their initial sources, you find that the carbon number (ca. 25% total global soil carbon) comes from large pedon databases with information on typically 3,000-10,000 soil profiles that were developed over several decades. Here’s an example. There is no reason to doubt these data, but they do have some limitations like several noted in Campbell et al. (2008):

The methods for estimating carbon storage vary widely, and no single method is considered highly accurate…The 1m depth is appropriate for this analysis, but likely underestimates carbon emissions from deeper peatland systems. No global dataset of peat depth is yet available.

This brings up an interesting point which is that the percentage might be a lot smaller if you account for Arctic peat and wetland C. From the most recent IPCC report:

The terrestrial biosphere reservoir contains carbon in organic compounds in vegetation living biomass (450–650 PgC; Prentice et al., 2001) and in dead organic matter in litter and soils (1500–2400 PgC; Batjes, 1996). There is an additional amount of old soil carbon in wetland soils (300–700 PgC; Bridgham et al., 2006) and in permafrost soils (see Glossary) (~1700 PgC; Tarnocai et al., 2009).

So if we count the additional carbon stocks in wetlands or permafrost, it could reduce that percentage of global soil carbon in drylands by about half, to ~13% of the global total.

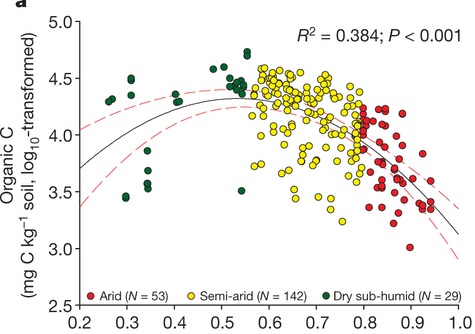
The Tarnocai paper does point out though that 88% of that unaccounted-for carbon is totally frozen right now. Some of that may well defrost and mineralize to CO2, but a lot of it still won’t. How much defrosts remains to be seen as climate change progresses. On the other hand, most C in drylands is very close to the surface and thus potentially vulnerable to loss with climate change. A new study in Nature shows that dryland C is negatively correlated with aridity in semiarid and arid ecosystems, so as desertification continues, drylands seem likely to lose soil carbon:
Image

In conclusion, current estimates of 25% global soil carbon in drylands come from soil profile data and the limitations of those data include (1) they are not necessarily collected with consistent methodology and (2) they generally don’t include carbon deeper than 1 m. Depending on whether you count old carbon in permafrost and wetlands, the total percentage of soil carbon in drylands may be more like 13%, or half of what is often cited. However, because dryland carbon is near the surface, it may still be vulnerable to loss with climate change.

Comments Off on How much carbon is stored in dryland soils?

Crusts

August 25, 2013 – 11:59 am

crusts

I have enjoyed boning up on my biological soil crust knowledge during my first few weeks here. Here’s a crust picture I took on a trip to the Canyonlands National Park Needles District back in January 2006. This crust probably took decades if not centuries to get to this point. These “pinnacled” crusts only form in dryland areas with cold winters like here on the Colorado Plateau. The structure is created by freeze-thaw cycles.

Here’s the definitive book on the subject that I’ve been poring through:

It’s got tons of great information and hopefully some of my work here will be able to contribute to our more general knowledge of how this cool component of dryland ecosystems might respond to the forces of global change we are inflicting upon them.

When I was looking for the above crust picture, I also came across a panorama of Chesler Park that I had never stitched together. Enjoy:


Comments Off on Crusts

Drylands biogeochemistry

August 8, 2013 – 6:21 pm

Image

I’ve just begun a new postdoctoral position at USGS in Moab, Utah. Now that I’ve drawn my Arctic project mostly to a close (a few papers still to finish up), I am really excited to shift from the tundra to the desert. Though the ecosystem is different, the nature of the project is the same as my previous work in which I have applied biogeochemical and ecophysiological methods to understand how global change is affecting ecosystems.

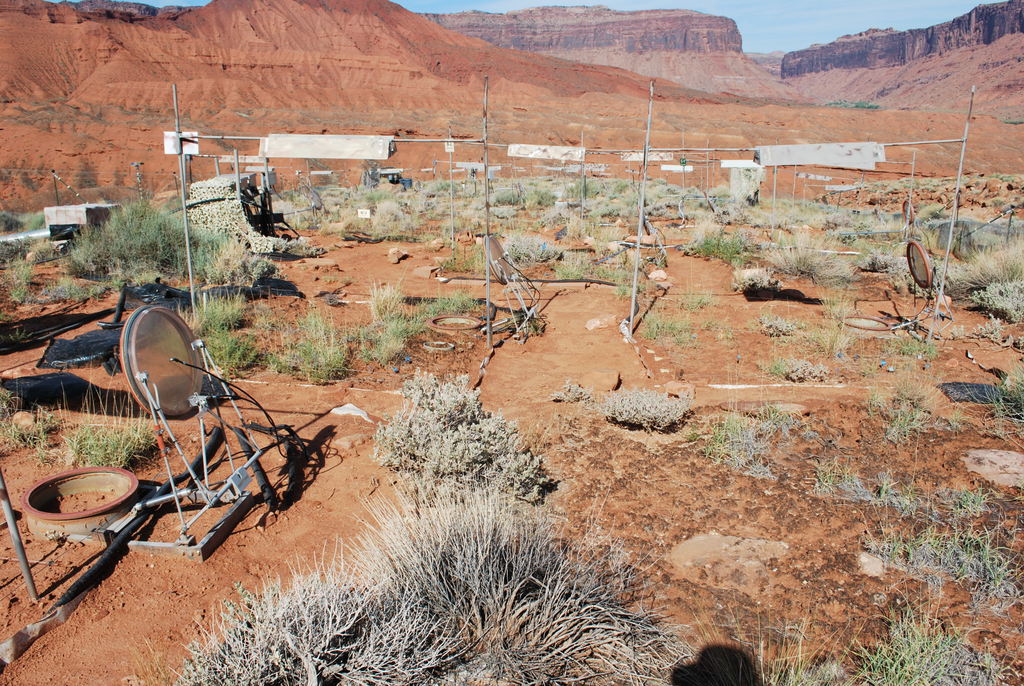
Here in Moab, I will be working with world renowned soil crust expert Dr. Jayne Belnap as well as my grad school friend and fellow biogeochemist Dr. Sasha Reed. We’ll be leveraging an awesome field experiment that Jayne has been running near Castle Valley, Utah for the last seven years. It’s a DOE-supported project in which they have applied warming (via infrared lamps, see above) and watering treatments to crust-dominated desert soils. It also features an automated CO2 chamber system (lower left on picture) that is producing some sweet data. They have seen some interesting results so far and I am excited to jump in and contribute to and build upon this project.

It’s fun to be back in the American West and to live in a place that my family used to go on vacation. I first rolled through Moab when I was about 10 in 1991. It’s grown since then but appears so far to be just as much fun! We’ve already been to Arches about 5 times and met lots of nice people. Should be fun!


Comments Off on Drylands biogeochemistry

Data Science

April 15, 2013 – 6:47 am

I just read an interesting article in the New York Times.

Universities can hardly turn out data scientists fast enough. To meet demand from employers, the United States will need to increase the number of graduates with skills handling large amounts of data by as much as 60 percent, according to a report by McKinsey Global Institute. There will be almost half a million jobs in five years, and a shortage of up to 190,000 qualified data scientists, plus a need for 1.5 million executives and support staff who have an understanding of data.

And from the McKinsey report:

To capture the full economic potential of big data, companies and policy makers will have to address the talent gap. New research by the McKinsey Global Institute (MGI) projects that by 2018, the United States alone may face a 50 to 60 percent gap between supply and requisite demand of deep analytic talent, i.e., people with advanced training in statistics or machine learning.

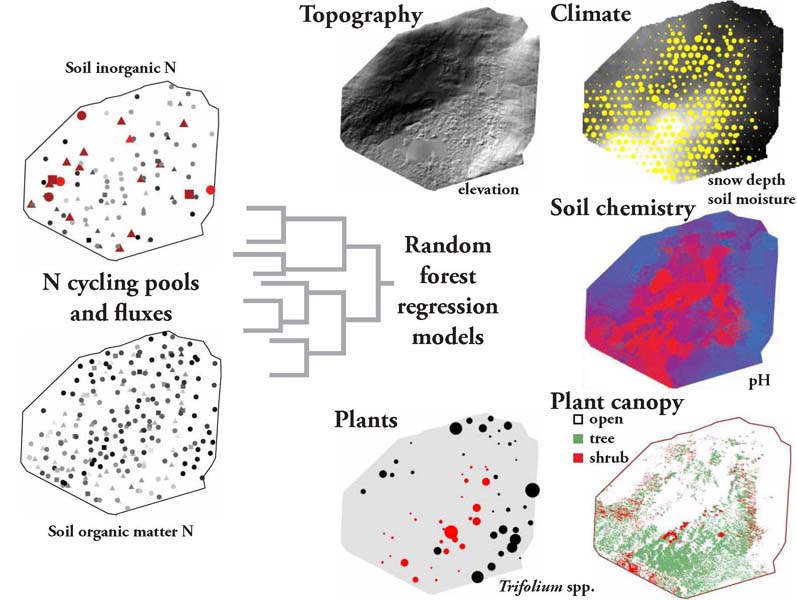
Machine learning techniques were one of the core analyses in my dissertation research (example below). I know that as I went deep into learning and using these methods I was struck by their power and broad generality. I realized, oh, this is what Safeway is doing with all that data they collect from my ‘rewards’ card. These techniques are a huge upgrade from the clunky and drawback-ridden multivariate techniques of the past.

Many businesses are already reaping the rewards of using machine learning and other big data techniques, while I suspect others are just jumping in or are ramping up their operations. At the same time, public consciousness of these methods has been raised with the likes of Moneyball and Nate Silver’s entertaining pwnage of the ‘experts’ and prediction markets in the last election. Everyone is realizing, hey this stuff actually works.

People also just have reams and reams of data these days. It is axiomatic in the world of data that it is easier to collect data than to analyze, visualize, model, and interpret it. Even before interpretation, just organizing data so it can be analyzed (see this for example) is a challenge and an art that requires practice with and knowledge of concepts like normalization and map/reduce.

Once data is organized, for all but the most basic analyses, interpreting data quickly forces you into the realm of epistemology. This is the intellectual challenge that I love about statistics.  You can’t just calculate mean±SE and call it a day; instead you have to ask what insights are possible, quantify how certain you are of those insights, and perhaps most importantly, define which insights are not possible. In other words, how can you extract truth from numbers without overreaching? This is a huge challenge and even with the latest techniques, pitfalls abound.

I think this critical thinking aspect of data analysis is not obvious to those with a more surface-level knowledge of statistics. Introductions to statistics tend to focus on how to “test” things, a rampant paradigm that I see as deeply problematic. For universities developing data science courses, this may also be an area where the better programs will instill the critical thinking skills while the weaker programs just teach you the latest algorithms. Either way, the students in the  earliest programs seem to be doing pretty well:

North Carolina State University introduced a master’s in analytics in 2007. All 84 of last year’s graduates in the field had job offers, according to Michael Rappa, who conceived and directs the university’s Institute for Advanced Analytics. The average salary was $89,100, and more than $100,000 for those with prior work experience.

Anyway, this is cool stuff. I know I would have loved to take some data science courses when I was in school. It would have been a nice complement to all the self teaching I ended up doing out of personal interest and necessity for my research. There are so many great topics from the machine learning algorithms themselves to the Bayesian v. frequentist paradigms to more obscure stuff such as retinal variables and shrinkage.

When I was at AGU last December, I noticed that Facebook was looking to hire scientists to do this kind of work. Since the big tech companies like Facebook are at the cutting edge of implementing these methods, the fact that Facebook was trying to vacuum up talent in this area seemed to be an indicator that other companies would follow. I for one will be continuing to bone up on all of the latest tech in this area.


Comments Off on Data Science

Web slideshow of my dissertation

March 7, 2013 – 5:05 pm

I just put up a web slideshow version of my dissertation based on my exit talk that I gave upon graduating from CU. I hope it will be useful for future students working on Niwot Ridge and anyone else curious about nitrogen cycling or biogeochemical hot spots. It features some of my best photos and graphics from my work in the Colorado Front Range and is annotated with descriptions of the project.


Comments Off on Web slideshow of my dissertation

Visual exploration of multivariate time series data in R using ggplot

February 21, 2013 – 11:19 am

Image

I want to share some data manipulation and graphing techniques I have found useful for making flexible visual comparisons of time series data in R. These techniques can be pieced together from the documentation of the R packages and various online forums but sometimes it’s helpful to have a fully integrated example based on real data, so that’s what I’m presenting here.

The problem at hand is that we have dozens of variables from our Arctic experiment that we have measured over the same time period, in our case three summer field seasons. We want to be able to compare subsets of the variables or even all of the variables on the same temporal axis so that we can see which events in the data line up temporally.

I took three main steps: (1) melt the data frames that contain all the variables into data frames with a uniform column structure; (2) bind all variables into a giant data frame using rbind; and (3) use the mapping and paneling features of ggplot2 to draw plots.

Step 1: The melt function
This function is a really nice and generally useful technique to have in your munging arsenal. Basically it reformats your data into a “long” format in which there is only one column called ‘value’ that contains all numeric response variable data and then adds a column called ‘variable’ listing the variable name.

The melt function has a complementary function cast that goes in the reverse and casts your melted data frame in whatever “wide” format you want. That’s great for making paired comparisons, though it is not needed for what I’m doing here. Together these are a great way to reshape your data frames to whatever format you need and are a lot better than the confusing reshape function.

The example I’ll show can be run on your own machine after loading the data:

load(url(paste("http://anthony.darrouzet-nardi.net/",
 "data/snowmelt_project_example.Rdata",sep='')))

Melt the data frames containing diverse data sets, in this case soil cores (destructive harvests=dh), air temperature, and snow cover. The date is in day of year format (the doy variable).

require(reshape2)
dh.m <- melt(dh.blog,id=c("year","doy","block","treatment")) airtemp.m <- melt(airtemp.blog,id.vars=c("year","doy",  "block","treatment"), measure.vars = "air_temp_mean",na.rm=T) snowcover.m <- melt(snowcover.blog,id.vars=c("year","doy",  "block","treatment"))

By default it will melt all columns that are not id.vars into a single column. To select only certain columns, identify them as measure.vars.

Step 2: rbind
This is the easiest step, typically one line of code with maybe a few modifications to the resulting data frame. The order of the data can be relevant for ease of graphing them in a particular order, but there are always ways to change that sort of thing downstream as well. Make sure before binding that the data frames to be stitched together have identical columns and column names (colnames).

snow_project <- rbind(snowcover.m, airtemp.m, dh.m) snow_project$treatment <- ordered(snow_project$treatment,  c("C.N","A.N","C.O","A.O"))

Step 3: Graph with ggplot
Let's say we want to compare ammonium and nitrate from the soil cores with air temperature and soil cover. That's all the data I uploaded for the example, but for our actual project there are way more variables. This is the graph shown at the top of the post. Click it for larger size.

require(ggplot2)
require(Hmisc)
theme_set(theme_bw())
ggplot(subset(snow_project,
  (variable=="nh4"|variable=="no3"|
  variable=="air_temp_mean"|variable=="cover")),
  aes(doy, value,col=treatment)) +
 geom_line(stat = "summary", fun.y = "mean",lwd=1) +
 stat_summary(fun.data = "mean_cl_normal",conf.int=0.68,lwd=.2) +
 scale_color_manual(values=c("black","green","orange","red")) +
 facet_grid(variable~year, scales="free_y")
#this takes a sec to print due to the error bar calcs

First I subset the massive snow_project data frame to extract the variables I am interested in graphing. The subset can be left out if I want to graph everything all at once. For my current project, I have been having R draw a massive 110×30 inch pdf.

You want to take advantage of (1) the panel system in facet_grid along with (2) what data visualizer Jacques Bertin calls "retinal variables." These are the colors, shapes, symbols, textures etc that you use to encode additional data dimensions. Between retinal variables and panels you can show a lot of variables in the same graphic.

In the example, treatment is color coded using the col argument in the main ggplot input function. If you had another variable you needed to show, the shape argument is probably the next most useful after color. Use the show.pch() function in the Hmisc package to see what shapes are easily available.

After deciding what you want each panel to look like, the facet_grid function divides your plots up into separate panels by variable allowing easy access to any kind of comparison we want. The formula input is vertical~horizontal for panel structure. In this case we have variables stacked on one another and horizontal separation by year. The scales="free_y" is essential for this approach because it allows your different variables to each have their own axis scale. For some variables, we might prefer to plot them in the same panel (like say soil and air temperature). In that case, pull variable out of the facet_grid function and put it in col or shape.

This series of steps works great for time series data, but the techniques in the three steps can be useful for other non-time series data as well.


Comments Off on Visual exploration of multivariate time series data in R using ggplot