Microplate calculation spreadsheets
June 7, 2012 – 5:24 pm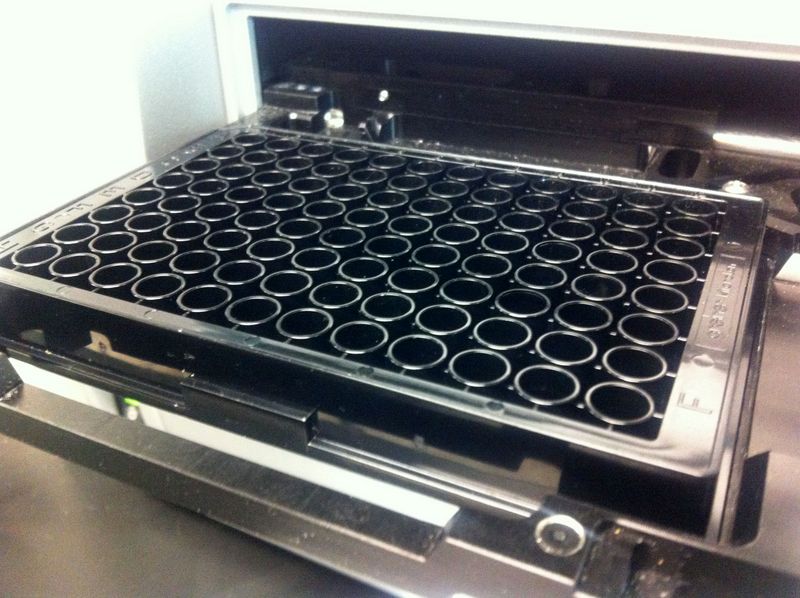
I know this is for a narrow audience, but I’m always surprised by how much finding random things like this online can help me, so here we go.
The goal is to paste raw microplate data into a spreadsheet and get out the final numbers you need. If you had thousands of microplates, it might be better to write a short program that can process the data, but for everyday lab analyses that change frequently and are implemented by many lab personnel that don’t program stuff, the spreadsheet is a good tool.
I’ve made a lot of these spreadsheets over the last few years to help process enzyme and nutrient data. Here’s one I made recently. It has a few parts in the different worksheets: (1) the blank template in which raw data can be pasted; (2) a pipetting map to be printed so that you know where to put your samples when you are pipetting; (3) simulated data that helps to identify the assumptions you are making about sources of well absorbance (for colorimetric assays) or in this case fluorescence; and (4) a run with the modeled data to help spot errors in the spreadsheet.
Here are some guidelines I have learned over the last couple years that I think make these spreadsheets more useful for our lab group.
(1) Label all the parameters. In particular, formulas should only have references to other cells, not any hard values like mass of soil used or volume of extractant, etc. This will prevent having to search all cells whenever you change one of these variables.
(2) Highlight anything you have to enter when samples are run so you don’t forget anything.
(3) Don’t make overly complicated formulas that are difficult to decipher later. To prevent this, divide up long calculations into two or more steps so each is more clear.
(4) Test the spreadsheet with simulated data that you create to look similar to real data but with nice round values. This will help you identify assumptions in the way calculations are made as well as locate typos in calculations across many spreadsheet cells.
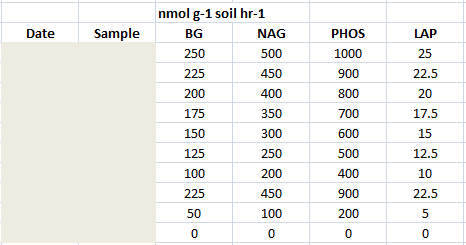
(5) Make the output of your spreadsheet into a well organized table (below) that has only sample ID information and the final values in preferred units. Then you can grab these values to use for stats and comparison with other assays, leaving all the processing behind.
Sorry, comments for this entry are closed at this time.