Mountain pine beetles and ecosystem carbon

January 12, 2012 – 4:18 pm


Really nice video here featuring a couple of my advisors from CU as well as my good friend Nicole Trahan. Videos like this may not rack up Bieber-level interest on Youtube, but for those that care – including policy makers and students – this seems like a great way to get across the main ideas of a research project to a broader audience. I hope more groups follow this lead.

As for the science, it’s interesting to see the importance of root exudates to the story of ecosystem carbon balance in these forests. We have been moving in the same direction of focusing on root-microbe interactions on our Arctic project.


Comments Off on Mountain pine beetles and ecosystem carbon

Ongoing debate over effects of N deposition on forest carbon storage

January 10, 2012 – 4:44 pm

There was an interesting note in the most recent Global Change Biology about whether N deposition might fertilize temperate forests and cause them to remove and store carbon from the atmosphere, providing some small relief from ever-climbing atmospheric CO2 levels. Author Peter Högberg writes:

It was first widely held that N deposition should increase tree growth in the northern hemisphere, in particular (e.g., Townsend et al., 1996); the Kyoto protocol even stated that this effect should be accounted for. However, based on the distribution of 15N tracer added experimentally to forests in Europe and N. America, Nadelhoffer et al. (1999) proposed that the effect of N additions on C sequestration should be minor as they found that most 15N ended up in the soil rather than in the above-ground parts of the trees. Their proposition was challenged by Magnani et al. (2007), who, based on estimates of net ecosystem production (NEP) derived from eddy-covariance studies, argued that the correlation between C sequestration and N deposition was very strong, with a slope indicating that many hundreds of kg of C were sequestered per kg of N deposited on the forest.

Högberg then goes on to provide some evidence that the correlation between NEP and N deposition may not be causal since humans tend to populate (and pollute) areas that are already more productive and likely to naturally sequester more C. It is an interesting explanation of the data and I will be curious to see any response Magnani et al. may have. Either way, it is certainly difficult to figure out what atmospherically deposited N does in these ecosystems since there is still a lot we don’t know about belowground ecosystems and tree ecophysiology.


Comments Off on Ongoing debate over effects of N deposition on forest carbon storage

How to find a good cheap laptop

January 2, 2012 – 5:37 pm

I recently bought a new laptop and it’s worked out well for me so I wanted to share what I discovered in the search process. I am by no means an expert in the laptop market, but it can be helpful anyway to hear from someone like me who attempted their own product research and ended up with something they liked. So here is what I learned:

1. Brand is irrelevant. The exception of course is Apple. I have had a lot of good Apple products over the years and if you have plenty of money, buying Apple is a good way to ensure your machine will have good components and generally not suck. However, this post is about cheap laptops.

2. For cheap laptops, you can’t get (or at least I couldn’t find) a mix-and-match your own components type of vendor, so you have to choose among the pre-assembled options. When I went into this, I was thinking that I didn’t need a CD drive since they are increasingly obsolete. However, all cheap laptops had them, so I didn’t have a choice.

3. At the low end ($300-$800), the main thing separating laptops is their processing power, so a laptop is a good deal if it has high processing power for a low price. The other components are pretty standardized at the lower prices. When I was looking, they all had a 15″ screen, probably 1366*768, 500GB hard drive (more than enough for almost all users), and 4GB RAM (don’t skimp on RAM).

4. Review sites like CNET are pretty much useless. It’s not impossible that you will discover a useful nugget about why a particular machine sucks, but these reviews tend to be really subjective and bad at comparing the hundreds of available choices. User reviews on vendor sites can be slightly more useful, but still should not guide your narrowing process.

5. The best comparative shopping tool I found was on newegg.com. It allows you to sort many different ways and narrow by particular features. There may be one or two other good comparison tools online, but I was surprised by how much these tools tended to suck. Even the Amazon one is crap. After sorting by price on newegg, you can isolate the dozen or so low-price machines that are currently available.

7. To choose among those, evaluate their processor performance by checking their listed CPUs and GPUs on these lists. One trick here is that the GPUs are often integrated into the CPU, so that can be helpful in identifying the GPU by looking for a similar number.

http://www.cpubenchmark.net/cpu_list.php

http://www.videocardbenchmark.net/gpu_list.php

This is where you will find a lot of variation. Some machines are cheap because they are a good deal and others are cheap because they have crap chips from two years ago. You also want to be able to see if you are paying a lot for a small performance boost or vice versa. These lists are the only quantitative way I found to assess differences among the chips. Don’t just check CPU: you want good graphics performance for streaming media and even just navigating through your files and apps.

8. Finally, once you identify a model you like, read the user reviews on newegg and amazon and elsewhere to see what they say. If you did good research, you may discover that other users can confirm for you that they came to the same conclusions. Also, search around the web to see if any of the other vendors have good deals on your model. I found my machine on newegg, but then Amazon ended up having a sale on it so I got it there.

I ended up with a machine that was $425 on amazon with a CPU benchmark of 3562 (AMD A6-3400M) and a GPU benchmark of 453 (AMD Radeon HD 6520G). Thanks to the glory of the invisible hand, you should be able to find an even better deal today.


3 Comments »

DOE launching a big project on Arctic carbon

December 19, 2011 – 8:19 pm

From a Nature news article:

The US Department of Energy (DOE) is embarking on a US$100-million research programme … designed to develop a fine-scale model that can simulate how soil microbes, plants and groundwater interact on the scale of centimetres to tens of metres, to control the amount of organic carbon stored underground in the permafrost zone. That model will be incorporated into the planetary-scale Earth-system models used to forecast how climate evolves under different emissions scenarios.

It sounds like it will be similar in size and scope to the FACE experiments, a set of CO2 enrichment experiments familiar to most ecologists. The goal to include belowground ecology in their models is quite ambitious, but hey, why not think big? I look forward to seeing how this project unfolds.


Comments Off on DOE launching a big project on Arctic carbon

Major NYT article on Arctic permafrost carbon

December 17, 2011 – 2:43 pm

Don’t miss this article in the New York Times this morning about Arctic permafrost carbon. It’s an excellent summary of a lot of current Arctic carbon research and makes a great case for the relevance of our current Arctic project and the many others like it.

It draws together a lot of the points I’ve made over the last couple months on this blog including our uncertainty of the fate of permafrost C, the potential for a big global warming feedback, and the importance of fires, thermokarst, and good old decomposition. It also does a great job with methane, which I haven’t talked about much. Compared to my blog of course, the article presents the story in a much better package that people will actually read.

I generally agree with the presentation of the facts in the article, but I would make one adjustment to the story. To some extent, the article downplays the importance of the carbon-in, carbon-out equation. It does mention that:

The essential question scientists need to answer is whether the many factors they do not yet understand could speed the release of carbon from permafrost — or, possibly, slow it more than they expect.

For instance, nutrients released from thawing permafrost could spur denser plant growth in the Arctic, and the plants would take up some carbon dioxide.

As a nitrogen nerd, I love the nutrient shoutout, but the broader point is that beyond nutrients, the warming temperatures and increased atmospheric CO2 themselves are likely to make plants photosynthesize more, that is, take in more carbon. The balance of higher photosynthesis vs. increased decomposition is one of the hardest things to figure out. Thus, the “broccoli in the freezer/refrigerator” analogy would be more accurate if freezer/refrigerator also containted a live photosynthesizing Brassica oleracea plant.

Despite the uncertainty about what will in fact happen to Arctic permafrost carbon, I don’t think the article at all overstates the seriousness with which we should take this threat. It might not all go up in smoke and microbial respiration – but it might – and we have to take that seriously. Anyway, kudos to journalist Justin Gillis for bringing this interesting and important story to the masses. Looks like he has some other nice global change articles in the NYT here.


Comments Off on Major NYT article on Arctic permafrost carbon

Microbial communities in melting permafrost

December 14, 2011 – 4:23 pm

There is a cool new study in Nature about changes in the soil microbial community at the time of thaw. Using some cutting edge genomics-based approaches in which they sequenced massive amounts of DNA in frozen and unfrozen soil cores, the authors were able to show that:

…during transition from a frozen to a thawed state there are rapid shifts in many microbial, phylogenetic and functional gene abundances and pathways.

This past week at AGU, I was talking with some colleagues about microbial community composition during thaw. Some of the data from our Arctic project shows a rapid change in microbial C:N ratio combined with high nutrient levels in the soil solution around the time of thaw. My best explanation for those data is that there is a microbial turnover event in which lysed microbial cells release nutrients, which are subsequently taken up by new microbes. The great data that this team was able to generate seems consistent with that idea.

There were also some cool nitrogen-related findings like this:

Several genes involved in the N cycle shifted in abundance during thaw (Fig. 3c). For example, nitrate reductase I genes significantly increased, suggesting nitrate was available as a terminal electron acceptor, which was confirmed by its presence in the chemical data

Obviously these methods have a lot of potential for major advances in our understanding of soil ecology, which probably explains why there are so many departments seeking to add researchers familiar with these techniques to their faculty.

Although these findings don’t speak directly to the fate of permafrost carbon, it is becoming increasingly clear that there are huge changes in microbial function when soils thaw; the nature of those changes will likely dictate what happens to the stored C.


2 Comments »

AGU Fall Meeting poster

December 6, 2011 – 12:07 am

I am attending the American Geophysical Union (AGU) Fall Meeting this week along with about 20,000 other geonerds.

My poster (click to enlarge) is in the Friday morning session (GC51F-1070). On Wednesday afternoon, our whole Alaska project crew will meet and I’m looking forward to putting together all of the different parts. Other than that, I plan to check out a lot of science and enjoy SF.


2 Comments »

Magnitude of carbon sources

December 2, 2011 – 11:05 am

My brother suggested providing some context for the different greenhouse gas sources to help evaluate the potential contribution of Arctic permafrost carbon. Here is the graph from the 2007 IPCC report (click to see it bigger). The white (CO2 from peat) and blue (methane) bands on the bars will get much larger if a lot of permafrost carbon decomposes.


Comments Off on Magnitude of carbon sources

Latest on the fate of permafrost carbon

December 1, 2011 – 5:36 pm

A new analysis (paywalled) of the role of permafrost carbon in climate change was published this week in Nature by Ted Schuur and Ben Abbott. They helpfully compiled a lot of what we know and don’t know about the issue and made some best estimates based on a survey of experts. The bad news:

We calculate that permafrost thaw will release the same order of magnitude of carbon as deforestation if current rates of deforestation continue. But because these emissions include significant quantities of methane, the overall effect on climate could be 2.5 times larger.

The slightly less apocalyptic qualification to the bad news:

But despite the massive amount of carbon in permafrost soils, emissions from these soils are unlikely to overshadow those from the burning of fossil fuels, which will continue to be the main source of climate forcing. Permafrost carbon release will still be an important amplifier of climate change, however, and is in some ways more problematic: it occurs in remote places, far from human influence, and is dispersed across the landscape.

No actual good news at this point, but it will be interesting to follow the development of our knowledge on the fate of permafrost carbon.


2 Comments »

Which US agencies fund basic research?

November 19, 2011 – 2:48 pm

Lots of them, but mostly HHS, which I assume is mostly NIH. NSF comes in a not-so-close second.

Basic research funding, in billions of dollars (2008):
HHS    16.0
NSF     3.7
DOE     3.2
DOD     1.5
NASA    1.3
USDA    1.0
Other   0.8
Total  27.6

The US budget is around 3 trillion, so this is about 1% of total US spending.


Comments Off on Which US agencies fund basic research?

Open source GIS

November 17, 2011 – 5:22 pm

It would be awesome to have an open source GIS that works as well as R does for stats, and it looks like there almost is one. I checked out QGIS last week and was pretty impressed. I managed to get it installed and pull some of my thesis data in there and display it without any problem. QGIS had a really nice interface and smooth operation. It couldn’t straight-up convert my .mxd files but then I wouldn’t really expect it to be able to do that. It did easily import shapefiles and raster images, and displayed x-y coordinate data.

However, I quickly found a limitation, which was that I couldn’t implement the kriging procedure that was the goal of my session. I wasn’t trying to do something fancy, just a run-of-the-mill interpolation. Apparently there is some package called SDA4PP that implements a Geostatistical-Analyst-style interface, but my quest to install it quickly became a wild goose chase. Oh well. It looks to me like this type of functionality should be pretty close though.

The good news was that I realized that kriging procedures are pretty easy to implement in R. The tutorial on this page was really helpful.

Nobody likes dealing with the expense and hassle of running ESRI software. I would be more sympathetic to ESRI if they had good customer service like LiCOR, but last time I tried to ask a question they had some bogus system in which I had to contact a campus representative before I could talk to them… Thus, I must conclude that they have had a good run of it over the years, but that it’s time to go Firefox/MySQL/R on them. It also seems like a lot could be done with a user-contribution system like R. If I knew a grad student getting into GIS, I’d tell them to go straight for open source options.


Comments Off on Open source GIS

Muskingum River

November 3, 2011 – 1:39 pm

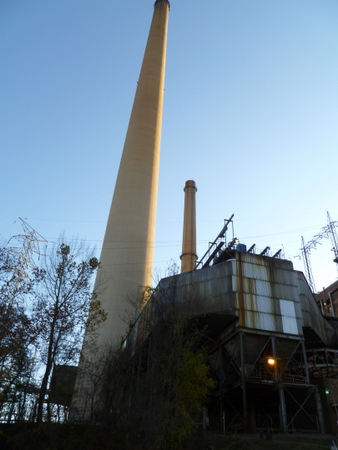
I went on a fun canoe trip on the Muskingum River a couple weekends ago. One of the unexpectedly interesting parts was seeing the Muskingum River Power Plant, a massive old coal-burning operation. It took the better part of an hour to canoe past the enormous premises.

I knew from my dissertation research that these coal-fired plants, particularly the ones in the Ohio River basin, were the biggest point sources of N deposition and acid rain in the country, the results of which can be seen by this map of rainfall pH from NADP (the plant is right around that 4.4 in southeastern Ohio).


Wikipedia confirmed that this plant is in fact one of the larger polluters in the area. It was interesting to see the sci-fi-looking machinery and giant piles of coal up close.

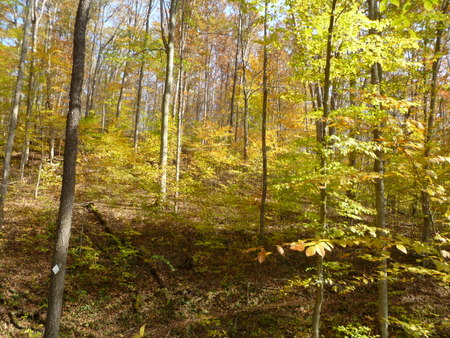
In addition to the power plant, we also enjoyed some great fall color.


1 Comment »

Climate deniers

October 29, 2011 – 11:49 am

Since I generally ignore climate deniers, I was surprised a month or so ago to see how bold and numerous they have become. This article is obviously bad – amusingly referring to the “Nature Journal of Science” (aka Nature) – but what really struck me was the comments, starring bogeyman Al Gore:

is somebody going to volunteer to call al? let me do it, i want to see his face, please, pretty please?
Algore’s “anthropogenic global warming” will go down as the greatest hoax ever perpetrated. Only in The Age of Stupidity™, ushered in by liberals over the last decade, could a large segment of the population be fooled into believing that their breath [co2 that plants absorb and is a building block of life], which amounts to less than 1/2 of 1%, will destroy the planet, kill polar bears and make puppies orphans.
The whole GW religion is imploding! While I’m happy it is, I really don’t think it will impact the idiots that vote for the left.
The Man-made Global Warming Crowd must be charged with a Crime… every one of them…. every last one.
Their words on TV and in print, and even their posts on-line can now be used against them, they must be found, and they must be put in prison.
alGore’s gonn’a sweat like a man-bear-pig NOW!!!

From these comments, it looks like there is a whole subculture of deniers with well established attitudes and memes. This strikes me as a different animal than just a few corporate-funded hacks sowing doubt at the behest of their overlords; instead, the tone of the comments suggests a hippie-bashing type of attitude adopted for the purposes of internet recreation. Juxtapose this sort of thing with corporate greenwashing and I’d have to say that Krugman hits the nail on the head:

You have various right-wingers simultaneously (a) denying that global warming is happening (b) denying that anyone denies that global warming is happening, but denying that humans are responsible (c) denying that anyone denies that humans are causing global warming, insisting that the real argument is about the appropriate response.


Comments Off on Climate deniers

Schimel Weintraub model

October 28, 2011 – 3:52 pm

At the Weintraub lab meeting, we’ve been talking with Daryl Moorhead about the Schimel Weintraub model of soil organic matter (SOM) decomposition. The main contribution of this model is to replace the empirical observation of exponential SOM decay with the mechanism that actually dissasembles macromolecules: extracellular enzymes (exoenzymes) produced by saprotrophs.

One interesting question that this modeling exercise brought up was: Why do SOM pools containing energetically favorable material persist in soils? In other words, why don’t microbial communities produce a ton of enzymes and eat everything available? The authors’ first try at simulating enzymes created this kind of unstable decomposition behavior:

…a stable system cannot be constructed when the kinetics are first order on enzymes, there must be a mechanism to produce non-linear kinetics. The specific mechanism in nature remains unclear, but one must exist. A likely mechanism is that as an organism produces more enzymes that must bind to solid substrates, they must diffuse further out from the cells, the substrates must diffuse further back, and enzymes may compete with each other for binding sites.

In this scenario, you have a relatively immobile organism that has to digest its food outside of its body and then hope that the food diffuses back to it. The authors’ hypothesis is that the ensuing dynamics within the soil matrix can greatly slow decomposition over time. This type of theoretical approach based on exoenzymes has spawned a lot of interesting followup work. Daryl for one has been working on making the model more sophisticated by including SOM pools of varying quality as would be encountered by real microbes.


Comments Off on Schimel Weintraub model

Arctic sea ice, warming, and soil carbon

October 19, 2011 – 4:15 pm

Andrew Sullivan linked a cool video of change in Arctic sea ice over time. Note the very low ice in 2007. It was about that low again this year.

He also linked an essay discussing some of the consequences of melting sea ice on the Greenland ice sheet, which could be pretty dramatic.

I wanted to add here that the melting sea ice and Arctic climate change are also having an effect on the terrestrial ecosystem. Right now, there is a huge unanswered question about the massive quantities of carbon stored in Arctic soils. If a substantial portion of this carbon burned off with warming, the increase in atmospheric CO2 could be on the same order of magnitude as existing increases from fossil fuels. That would be bad, hmkay. Right now we know that this is possible, but not a sure thing.

Many groups of scientists, including the group I am currently with, are trying to determine the likelihood of a positive feedback between warming and loss of carbon from Arctic soils. Our group just submitted a grant with some ideas on how to move forward with this question. This is a great opportunity to improve our basic knowledge of Arctic ecosystems, which is necessary to answer the question, but we definitely should all hope that our results do not indicate a strong feedback.


1 Comment »

Phosphorus sustainability

October 18, 2011 – 3:03 pm

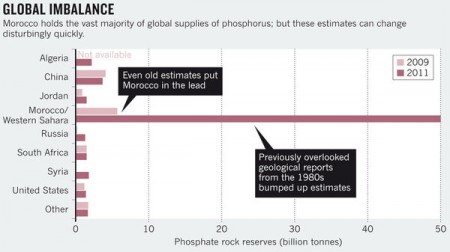
Sustainability issues surrounding phosphorus have been getting some attention recently, including an interesting commentary piece (requires sub) in Nature. Phosphorus problems are a combination of the problem we have with nitrogen – too little hinders food production, too much degrades environment – and the problem we have with oil, a valuable finite resource that corrupts the few locations in which large supplies are found.

One particularly interesting part was this graph suggesting that while data show that Morocco is the Saudi Arabia of P, wildly fluctuating estimates indicate that in actuality we have no freaking clue how much mineable P exists.


Comments Off on Phosphorus sustainability

Better default parameters for lattice graphics

October 10, 2011 – 6:59 pm

I use lattice graphics a lot, but I’ve never liked the default colors. Here’s the set of parameters I use instead. Anyone can load these in R with:

source("http://anthony.darrouzet-nardi.net/works/adnlattice.R")


Comments Off on Better default parameters for lattice graphics

Nitrogen biogeochemistry cheatsheet

October 8, 2011 – 5:56 pm

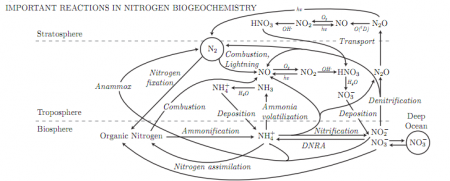
I was reorganizing my website yesterday and came across this Nitrogen biogeochemistry graphic I made a few years ago. It could probably use a few updates nowadays but it’s still a pretty decent guide for nitrogen n00bs.


1 Comment »

What forms of N are available?

October 5, 2011 – 7:06 pm

In the old days, it was assumed that the N uptake by plants and microbes was done via the labile currency of inorganic N ions: nitrate and ammonium. Later, it was discovered that plants and microbes could in fact take up amino acids as well, in a way “short-circuiting” the inorganic N part of the cycle. This leads to the question: what forms of N are actually taken up in the soil? A couple of interesting recent studies shed some light on this question and provide some good data suggesting that our understanding of labile N exchange is not complete.

Using pool dilution techniques, Wanek et al. show that:

…gross protein depolymerization exceeded gross N mineralization by >8 fold indicating that only a small fraction of amino acids released by extracellular enzymes was actually mineralized to ammonium.

Not only could litter microbes take up amino acids, but they seemed to snag them quickly enough that the inorganic N forms were never produced. These things are hard to measure so this is impressive.

Perhaps even more intriguing though, Farrell et al. conclude:

Our findings…point to a short-circuit whereby large peptides and proteins need only be extracellularly cleaved to short chain length peptides before direct assimilation by microbes.

This is a big deal because it means to understand labile N pools in soils, we may need to do a lot more than just measure inorganic N and amino acids; currently, most people don’t even measure amino acids.


Comments Off on What forms of N are available?

Science stimulus funding

September 29, 2011 – 12:28 pm

There is a news piece in Nature today about the effects of the stimulus (ARRA) on science.

One of the biggest legacies of the science stimulus, however, will be that thousands of students have stayed in science longer than they might otherwise have done. “ARRA has provided postdocs and graduate students with great training that’ll help them with the rest of their careers,” says Rockey. “These people will move on to do productive and wonderful things.”

It is certainly true for me that a postdoc opportunity was provided in which I am still gaining some great training. Hopefully their last prediction is correct as well.


Comments Off on Science stimulus funding

Changing seasonality in the Arctic

September 23, 2011 – 6:06 pm

Nice website put up by the Arctic Research Consortium of the U.S. (ARCUS) compiling all of the different seasonality projects that were funded by the NSF request for proposals that included the project I am currently working on. Should be a nice way for us to track publications as they come out over the next couple of years. Interesting too that “more than 85% of the funding for the 17 projects was provided through funds from the American Recovery and Reinvestment Act.” In case you didn’t know someone employed through the stimulus, now you do.


Comments Off on Changing seasonality in the Arctic

Rhizosphere dynamics theory

September 22, 2011 – 3:30 pm

Yesterday in the Weintraub Lab meeting, we discussed a great paper by Zoe Cardon and Daniel Gage from 2006 Annual Reviews. This paper ties together a lot of interesting concepts in soil ecology and we had a great discussion about rhizosphere processes and methods for testing these ideas.

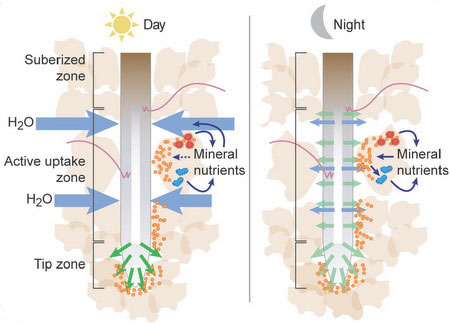
Most of our discussion was spurred by this awesome figure, in which the authors show their theory of rhizosphere dynamics:


The root is feeding the microbes (orange circles) carbon (green arrows) during the day. The microbes may also get a bit of carbon at night due to hydraulic redistribution. The microbes then produce enzymes to access nutrients needed for growth. When the root tip grows beyond the microbial biomass, grazers (red blobs) come in and eat the microbes, releasing excess nutrients. These nutrients are then taken in during the day by the root as part of the transpiration stream. This is a cool combination of a classic microbial community model (Clarholm 1985) with root physiology and plant water relations.


Comments Off on Rhizosphere dynamics theory

Confidence intervals for repeated measures analysis in R

September 19, 2011 – 4:49 pm

Our arctic experiment has two crossed factors, snowmelt acceleration and air temperature warming. We measure the effects of those treatments multiple times on a number of variables over the course of the summer, creating a repeated measures data set. Classic repeated measures ANOVA in R is easy to do. There is a good writeup here. Here’s the code for our data:

ml.lme <- lme(NH4~snow*otc*date.fac, ml, ~1|block)
anova(ml.lme)

However, I find that when I am looking at our data, I am not only interested in whether an overall difference is caused by our treatments, but would like to go further and quantify the differences between our treatments and our control over time and the associated uncertainty in those differences.
This type of analysis would aid us in making the quantitative statements we really want to make, like “in the early season, we saw 50±20% more N available, but later this difference dropped to 0±5%. There are a couple ways to go about this. One thing you can’t do is just use the confidence intervals on the coefficients of a mixed effects model like the one above. This is due to the way the contrasts are set up and the way that the interactions are treated in the model. The coefficients are not directly interpretable as the differences that you are interested in. Maybe there is a clever way to combine them, but if so I have not discovered an easy way to do that.

Staying with the one-big-model approach, it is possible to run a different model that allows as many individual contrasts as you want:

ml.lme <- lme(NH4~interaction(date.fac,snow,otc)-1, ml, ~1|block)
confint(glht(ml.lme, linfct=mcp(datetreat=ml.con)))

The ml.con object describes the contrasts (it’s a little but unwieldy to create, but doable). This model basically calculates coefficients that correspond to each treatment on each date, similar to calculating means and standard errors for each date, but using a pooled variance. This should work great if you have homogeneous variance between dates, but unfortunately for our data set (and probably most data sets), that is not a valid assumption.

A third approach is to run a separate model for each date. Here’s a quote from an essay by a statistics textbook author who more or less advocates this approach:

Forget about all the neat formulae that you find in a text on statistical methods, mine included. Virtually all the multiple comparison procedures can be computed using the lowly t test; either a t test for independent means, or a t test for related means, whichever is appropriate.

I tend to agree with that statement and here’s roughly how I implemented such an approach:

diff <- function(df) {df.lme <- lme(NH4~treatment-1,df,~1|block)
  confint(glht(df.lme, mcp(treatment = "Dunnett")))$confint}
ml.dun <- ddply(ml, .(date), diff)

I like this approach because I think this is what people are mentally doing when they look at a graph of a time series presented as means with standard errors (a very common presentation technique). Standard errors are usually calculated with timestep-specific variances and not with pooled variances, and since standard errors can be interpreted as confidence intervals, this is the implied analysis.

There is one more thorny issue that that author of the essay I linked above brings up and that’s the issue of what error rate to use for your confidence intervals. Do we need to Bonferroni correct them or otherwise adjust them? I would argue that we shouldn’t worry about this. As Rice (1989) points out, “there is no clear criterion for deciding when a simultaneous-inference test is required.” Rice suggests applying Bonferroni corrections when a group of two or more tests is scanned to see what is significant (i.e. a posteriori testing) or when two or more tests address a common null hypothesis. Sounds reasonable, but Cabin and Mitchell (2000) point out that it’s difficult to determine when either of these conditions are met. As my statistics handbook from my college stats class said, we may want to correct errors when we are trying to make statements such as “Some one or more of these are false.” I feel like I rarely need to make such an assertion and am thus not that bothered by the chance of having a higher groupwise error as long as I remember when inspecting the results that these are 95% and not 100% confidence intervals. For example, in the case of this data set, I don’t need to say “there is never a difference between our treatments.” Likewise, I can observe one date at which a “significant” difference is seen and disregard it as a fluke (e.g., the June 30 samples below where the controls were a little unusual).

Finally, here’s a graph of the results for the ammonium data, showing the mean differences±95%CI between each of our three treatments and the control. the three treatments are snowmelt acceleration, warming via open top chamber (OTC), and a both together. The overall conclusion here is that our treatments did not have a dramatic effect on ammonium at the times that we measured it, though we can be less sure about that conclusion at the beginning of the season.
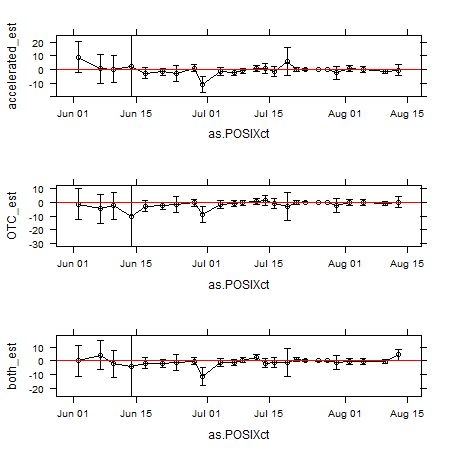

xYplot(Cbind(accelerated_est,accelerated_lwr,accelerated_upr) ~
  as.POSIXct(strptime(ml.dun$date,"%Y-%m-%d")), type='b',
  data=ml.dun, panel=panel.xydiff)

Comments Off on Confidence intervals for repeated measures analysis in R
Links: odds and ends

September 18, 2011 – 10:57 pm

A few links here that I wanted to share but didn’t end up writing posts about…

Op-ed about nitrogen pollution by Jim Galloway.

Debate about the ethics and philosophy of invasive species management.

Awesome photos from Greenland in The Atlantic.

Cool new paper on decomposition by my friend and fellow Toolik postdoc Jennie McLaren

Yet more ways in which p-values impede interpretation of data.

Outsourcing of scientific procedures: an interesting idea that I think has a lot of potential.


Comments Off on Links: odds and ends

Oak Openings fungus

September 17, 2011 – 9:48 pm

I hiked the 16.2 mile “Scout Trail” today at Oak Openings Metropark. It was a nice long hike and I saw some cool stuff like this shelf fungus. Not the best picture ever, but a neat specimen. Lots of neat fungi out at this time of year.


1 Comment »

Word of the day: munging

September 15, 2011 – 9:54 pm

Sounds kind of disturbing, but apparently ‘data munging’ is the name for a task I do all the time: taking raw data and converting it into a form that is usable for analysis. I usually call this data processing, but now that I know ‘munging’…

For my munging, I tend to use a combination of Excel and R. Given a reasonably small data set, Excel is good at getting observations in rows, variables in columns, and sorting them. But all further subsetting, aggregating, dividing, etc is better done in R using packages like plyr and functions like reshape, aggregate, and the incredibly useful summarySE.


3 Comments »

Snowmelt acceleration effects on soil temperature

September 14, 2011 – 1:42 pm

Back in Toledo this week! Toolik was great fun as always, but it is good to be home again.

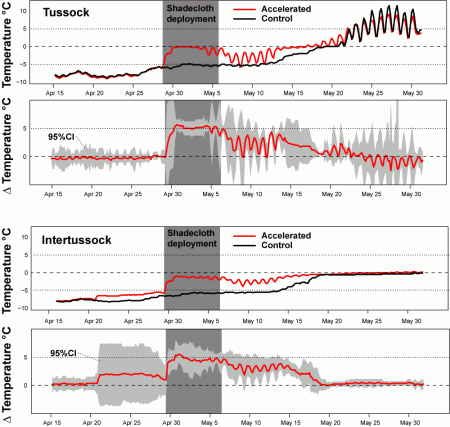
I just finished graphing some data showing the effect of our snowmelt acceleration treatment on soil temperature. The fabric (shadecloth) was on the ground for 8 days, creating a two-week acceleration in snowmelt. The iButtons were installed at a depth of 5 cm in August 2010 and left in the ground over the winter. Soil temperatures were definitely higher while the fabric was on and remained higher by a couple degrees while the snow melted off of the control plots. The upper panels show the mean temperatures for the two treatments and the lower panels show the difference between the treatments (accelerated-control). Click to enlarge.

Last year’s data here.

R code for the graphic here.


Comments Off on Snowmelt acceleration effects on soil temperature

Fall in the arctic tundra, ctd.

September 7, 2011 – 10:48 pm

Toolik Lake is already looking a lot different than two weeks ago. The snow will probably melt out before it sticks for good, but winter is coming soon. (Full panorama here)


Comments Off on Fall in the arctic tundra, ctd.

Last day of 2011 field work

September 6, 2011 – 10:59 pm

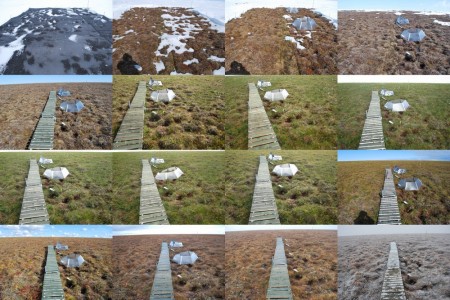
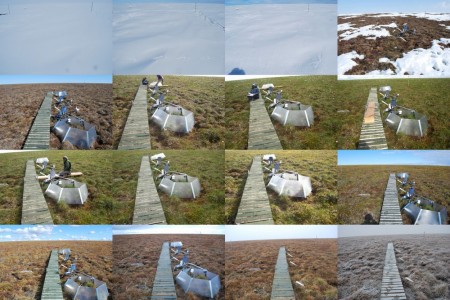
Over the last couple days, we packed up our instruments and grabbed some final samples. We enjoyed a fitting end for the season today with the first snowfall of the fast approaching arctic winter. We roll out of Toolik on Thursday. Here are some photos of two of our plots (May 3 – Sep 5; click for larger images). We achieved a snowmelt acceleration of two weeks this year.

Snowmelt accelerated using black fabric:

Control:

You can see the ice and light snow from this morning in the last picture. The ‘open top chambers’ elevate temperature by a few degrees, giving us crossed snowmelt acceleration and warming treatments.


2 Comments »

Recent N cycling discoveries using isotopes

September 1, 2011 – 6:07 pm

A couple of cool recent papers on N cycling, both based on isotopic data:

(1) Santoro et al. show that N2O from the ocean appears to be from ammonia-oxidizing archaea, counter to previous assumptions that it was from bacterial nitrification and denitrification:

Marine N2O sources to the atmosphere are estimated to represent ~30% of total “natural” inputs, or ~4 Tg N2O-N per year… Our results suggest that ammonia-oxidizing archaea may be largely responsible for the oceanic N2O source.

(2) Morford et al. found that plants in a Northern California forest were primarily using N from underlying rocks instead of from the usual atmospheric sources:

We report that the N content of soils and forest foliage on N-rich metasedimentary rocks (350–950 mg N kg−1) is elevated by more than 50% compared with similar temperate forest sites underlain by N-poor igneous parent material (30–70 mg N kg−1). Natural abundance N isotopes attribute this difference to rock-derived N: 15N/14N values for rock, soils and plants are indistinguishable in sites underlain by N-rich lithology, in marked contrast to sites on N-poor substrates. … Such N is primarily derived from the burial of organic matter in marine and freshwater sediments, where it is incorporated into rock as organic N or as ammonium in silicate minerals.


Comments Off on Recent N cycling discoveries using isotopes