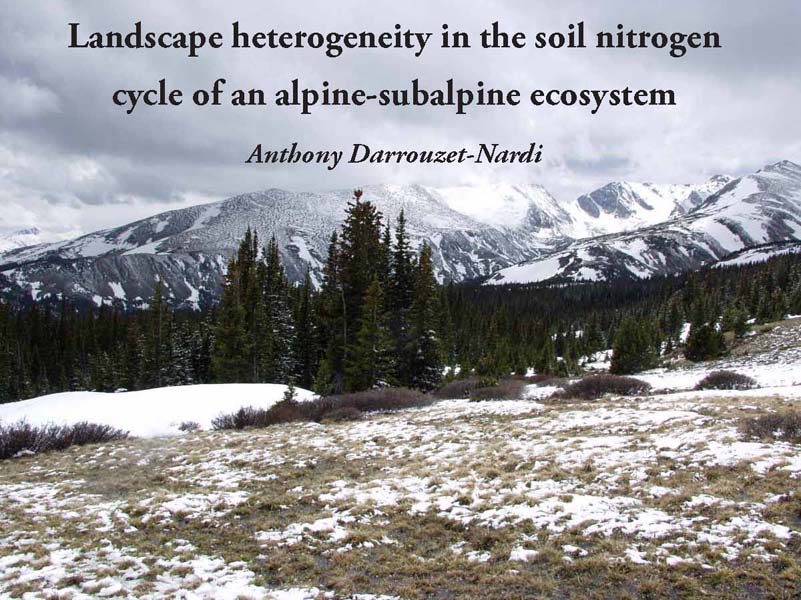
This is a web version of my dissertation exit talk given on April 23, 2010. I am proud of the work I did during my dissertation and wanted to share it here.
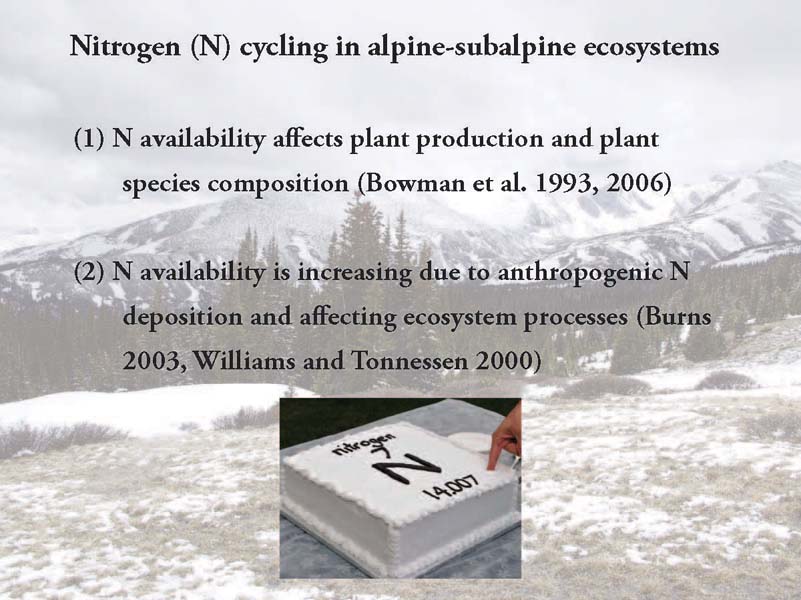
Nitrogen cycling is an important issue in the mountains of Colorado and in ecosystems generally. I got so excited about studying nitrogen that my wife Jaclyn made me a nitrogen-themed "grooms's cake" at our wedding.
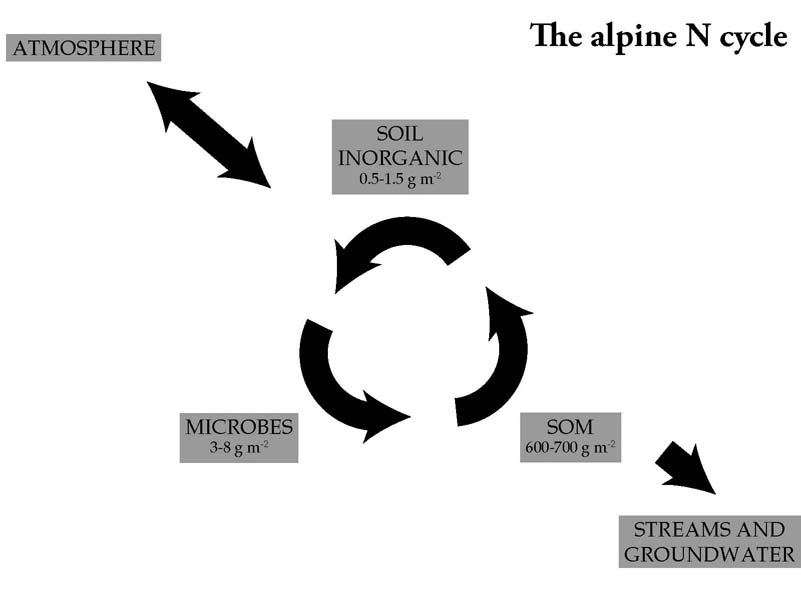
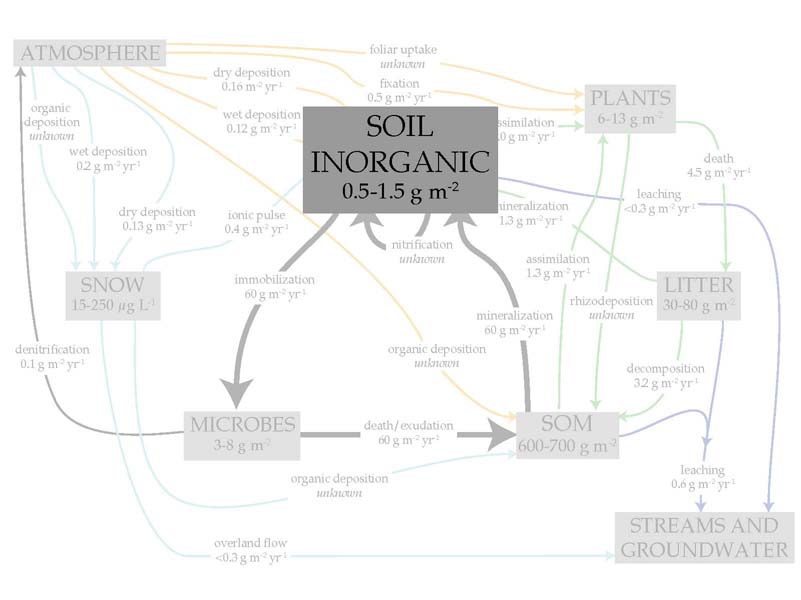
The alpine N cycle consists of two main parts: (1) a rapid internal recycling of N, mainly driven by soil microbes; and (2) imports and exports of N. Imports and exports are smaller fluxes, but over the long term determine the total amount of N in the ecosystem. Imports include processes like N deposition and N fixation; exports include denitrification and leaching.
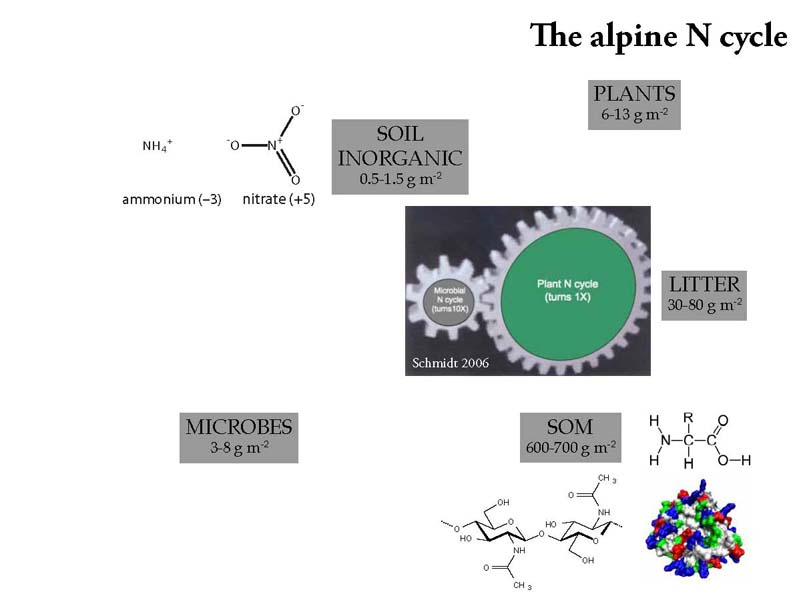
While microbes do most of the cycling, plants also cycle N, but according to the gear analogy hypothesis shown above, plants cycle N on the order of ten times more slowly. The molecules shown are some examples of inorganic and organic N. Inorganic basically means nitrate and ammonium. Organic N is complex and includes proteins, other polymers like chitin, and amino acids. One improvement to my dissertation if I could do it over again would be to measure more amino acid concentrations in my soil samples as their biological function is more like the inorganic N.
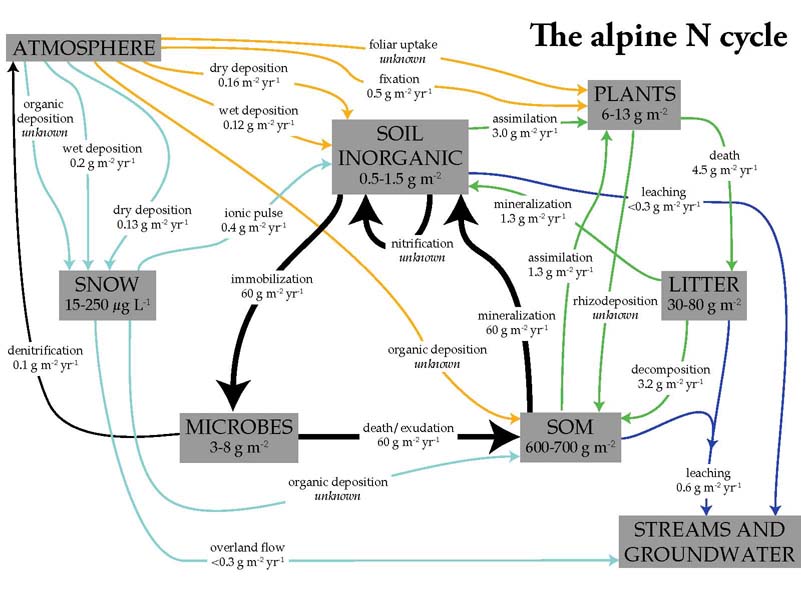
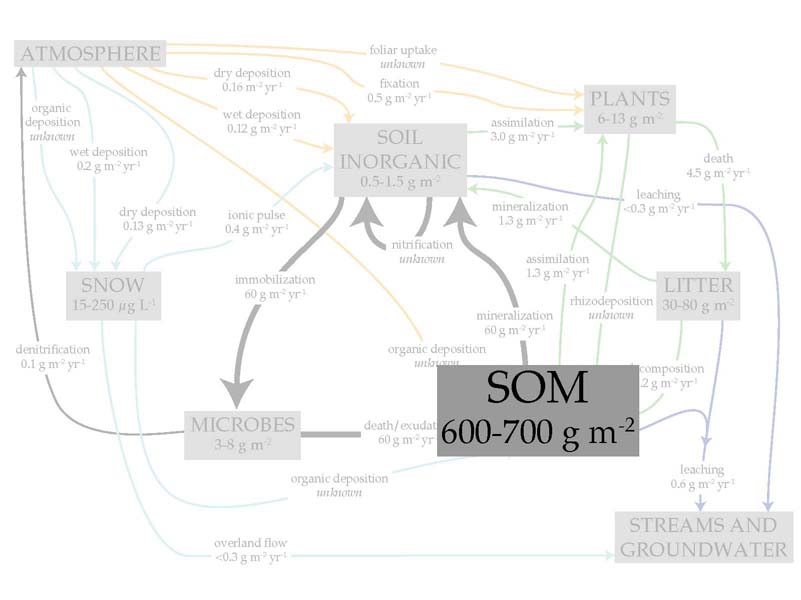
The simple diagrams in the previous slides end up looking more like this once all measured fluxes are combined together for an individual system. Having a nice set of N cycling measurements upon which to build was an advanatage of working at a well-studied site like the Niwot Ridge LTER. The tremendous complexity of ecosystem N cycling makes it fascinating to study but also a daunting task.

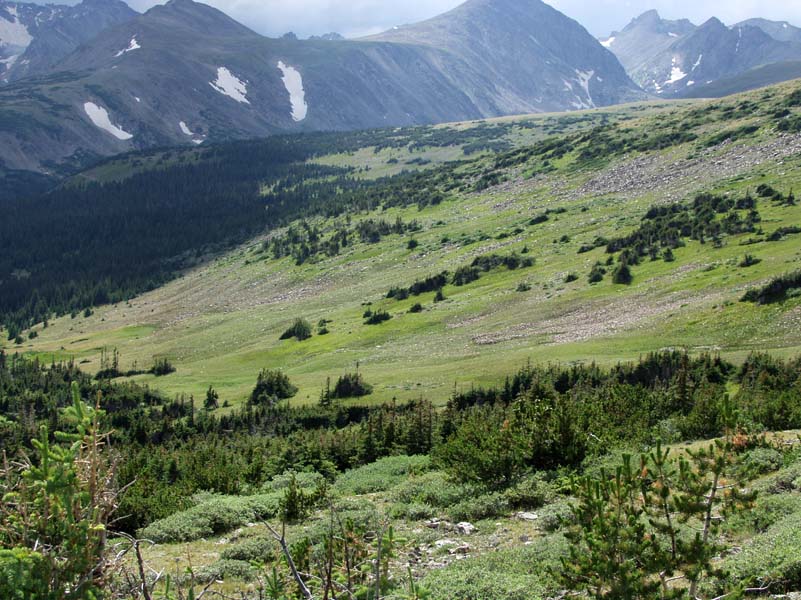
In addition to the complexity of the N cycle itself, the terrain of the Rocky mountains creates further complexity as N cycling rates vary with gradients of elevation and snow depth. Is it possible to fully understand variations in a complex cycle across a heterogeneous landscape? No, but we can still uncover important features of how ecosystems process this important limiting nutrient at the landscape level.
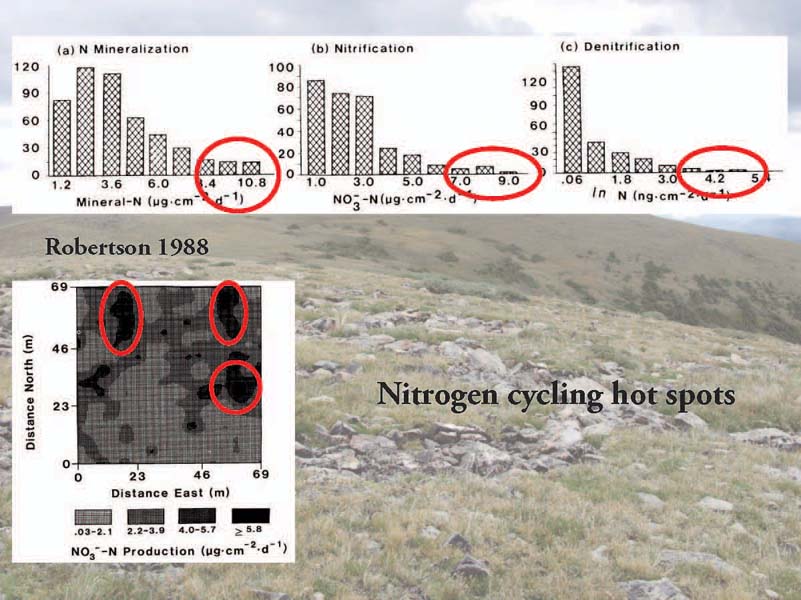
One of the notable features of measurements of inorganic N pools and fluxes across landscapes is that there are always massively outlying data points, or “hot spots.” These times and locations can be very important, accounting for a large percentage of total ecosystem activity. Observation of hot spots is common in N cycling data sets but relatively little is known about why they are observed.
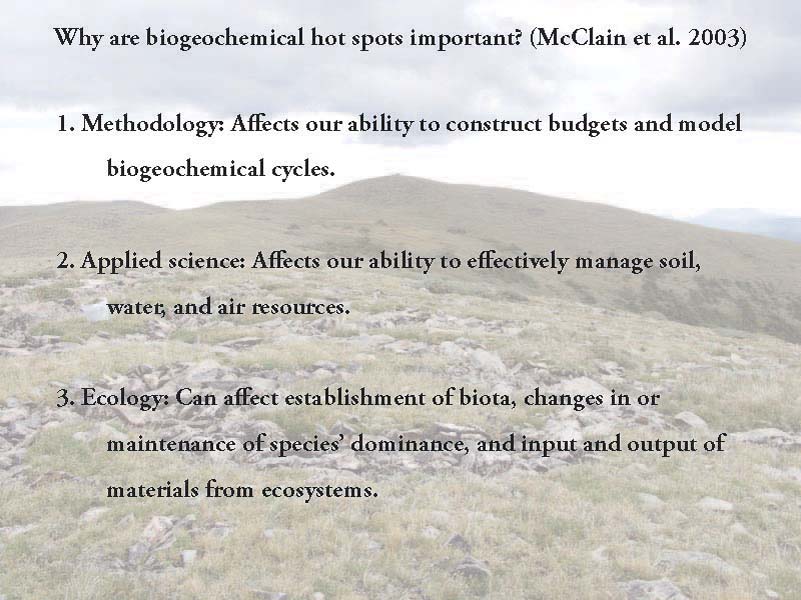
Understanding biogeochemical hot spots is important from a number of different perspectives including for methodological advancemenent and both basic and applied science. For example, in farmland landscapes, land managers seek to create denitrification hot spots by allowing riparian vegetation to grow between farmland and waterways, preventing N-rich effluent from flowing directly into streams and rivers.
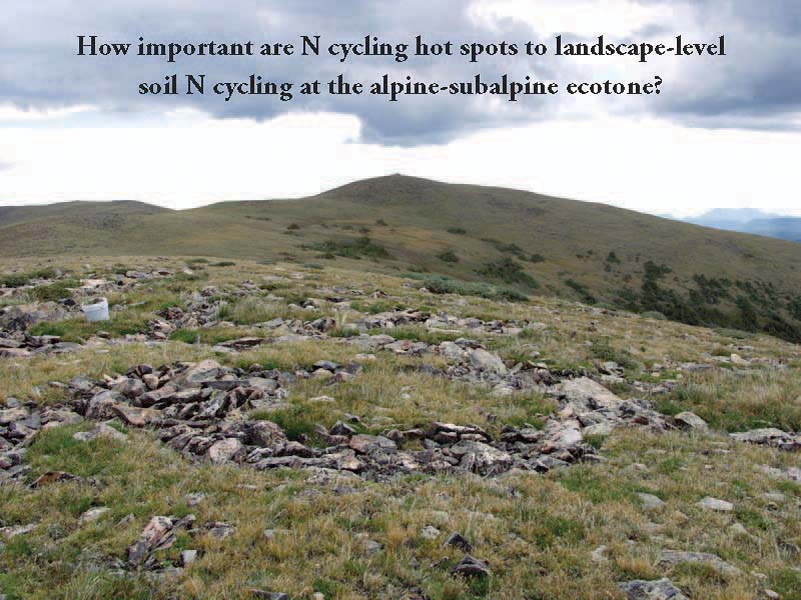
This is the main question I set out to answer with my dissertation. My goal was to improve our basic understanding of nitrogen cycling hot spots using Niwot Ridge as a well studied model ecosystem.
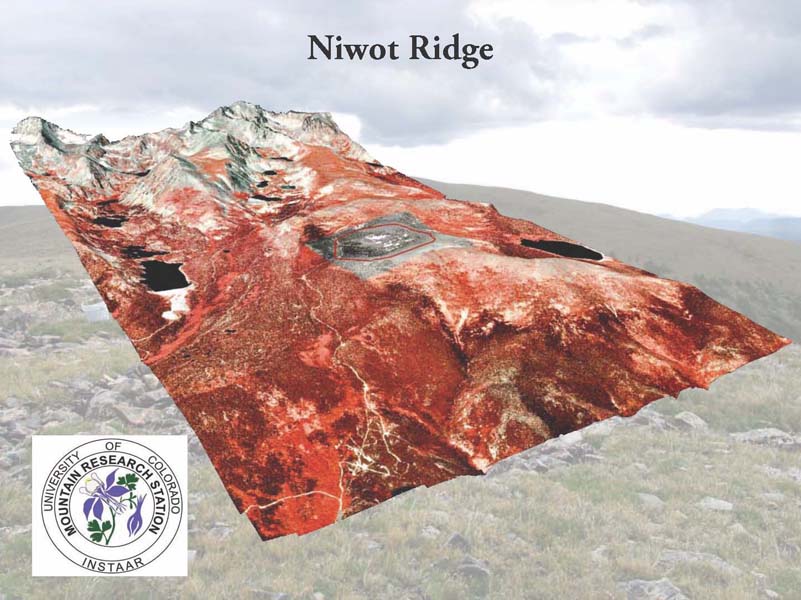
The Niwot Ridge LTER is centered on a long swath of alpine tundra going from the continental divide in the Indain Peaks Wilderness at 12,000+ feet down to treeline at around 10,500 feet. You can see my specific study location on the ridge in the embedded aerial photo. The colors on this infrared map indicate vegetation density. Darker colors indicate trees while lighter colors indicate herbacous vegetation.
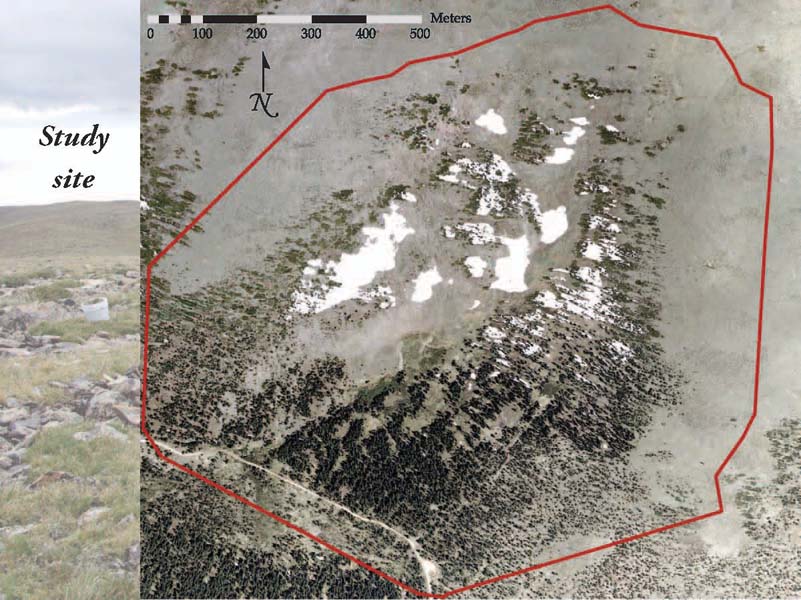
My field site was 0.89 km2 in size and situated at the alpine-subalpine ecotone, the point in the landscape at which tundra transitions into subalpine forest. I picked this site because the ecotone provides a great deal of landscape heterogeneity within a compact area.
The site contains several gradients such as the snow gradient from deep snowfields to dry windblown meadows; the windward and leeward slopes that range from 0-22°; and the ridgetop-sideslope-toeslope topography. The site also contains small seasonal wetlands and is drained by several intermittent streams that typically run May through July.
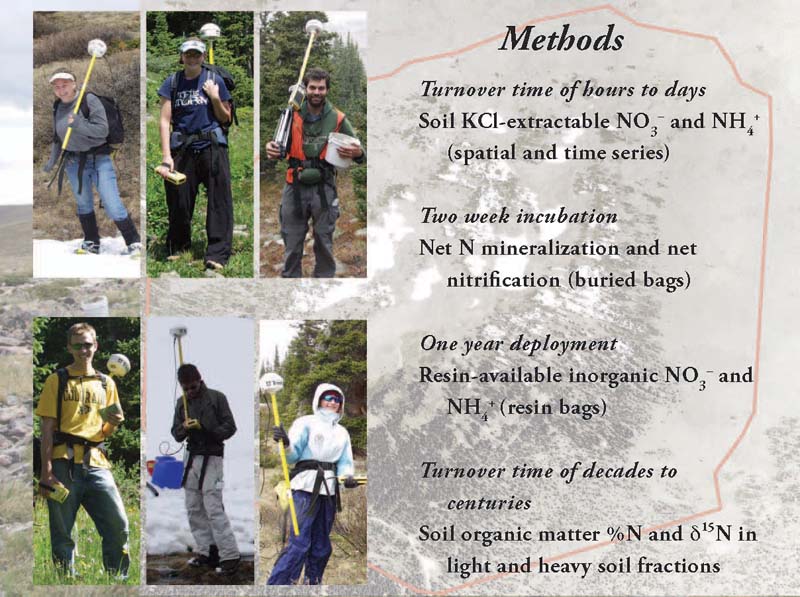
My approach to studying N cycling hot spots was to use a variety of measurement techniques that spanned different timescales and apply these techniques spatially across my study site. These techniques included digging up soil cores, incubating those soil cores in the ground, deploying nitrogen-collecting resins and analyzing overall concentrations and isotopic ratios of nitrogen in the soil. We used did lots of GPS work (see large yellow antenna above) to keep track of the locations of thousands of samples.
The largest pool of nitrogen in this ecosystem and most ecosystems is by far the soil organic matter. For the purposes of this talk I focus on this pool and the short-term inorganic pool, leaving out the resins (yearlong deployment) and two-week incubations for the sake of time.
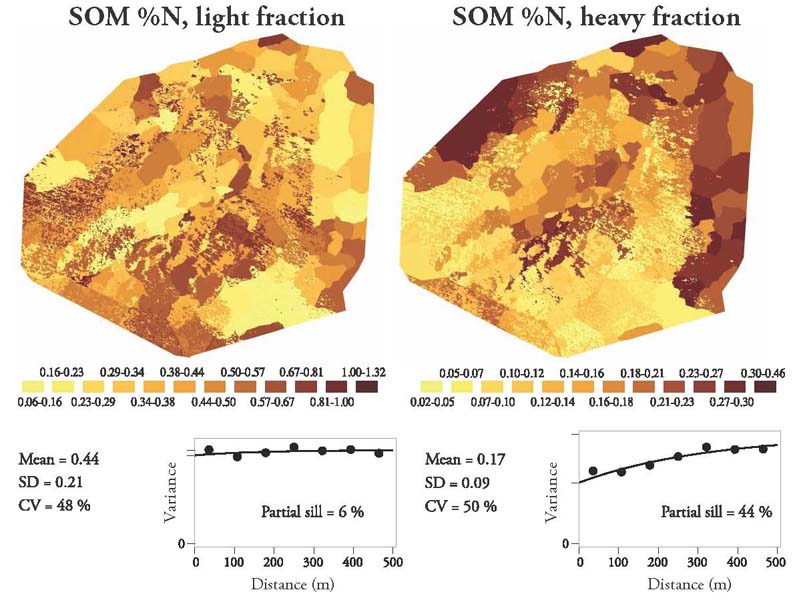
I separated soil organic nitrogen into two fractions, a light fraction consisting of newer material with a turnover time of about a decade, and a heavy fraction consisting of older, more dense material, with turnover times of decades to centuries. My first key finding was that while the light fraction was highly variable across the landscape, the heavy fraction was much less heterogeneous, showing a clear pattern in which the upper tundra areas had more heavy fraction N than the krummholz tree areas. The greater heavy fraction N in the dry meadow tundra communities at high elevations may be caused by low decomposition rates in those cold dry conditions. Here's the paper where I published this work.
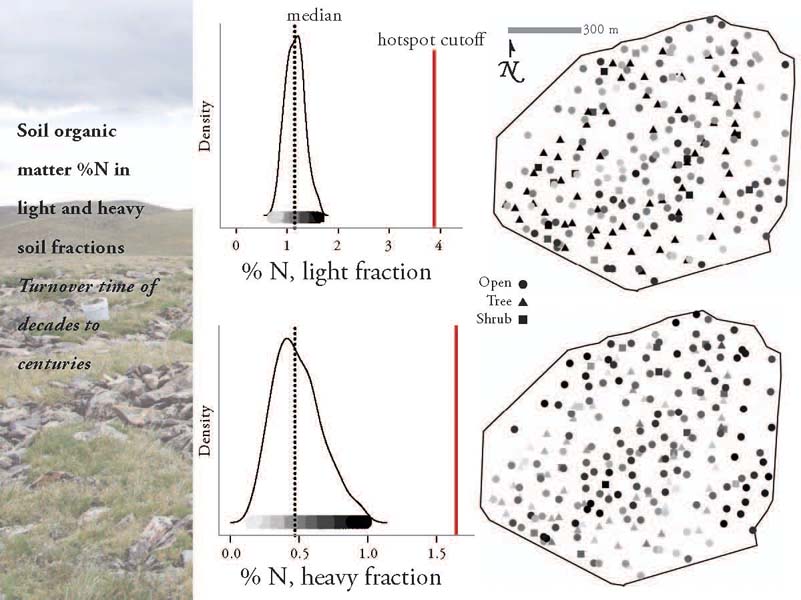
Despite the interesting patterns in the heavy fraction, and the difference in the levels of heterogeneity between the two fractions, these data did not suggest the presence of long-term hot spots of N cycling in particular locations across the landscape. The values were relatively normally distributed, with no values exceeding my mathematical definition of a hot spot (more details on the math here).
Compared with the soil organic matter, the soil inorganic pools are much more dynamic, turning over in a matter of hours or days. This is where N cycling hot spots — disproportionately high values — are typically observed.
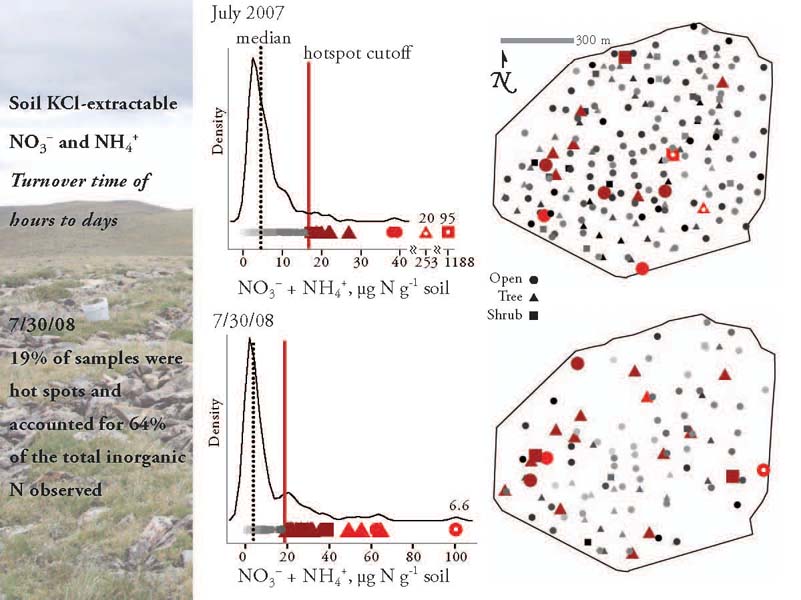
And indeed, when I measured the size of the inorganic N pool across my study site, first over the course of a month in July 2007, and then all in one day on July 30, 2008, I found that, for example on July 30, 19% of the samples accounted for 64% of the total inorganic N that was observed that day. However, that still leaves 36% of the samples in non hotspot locations, so we cannot simply find the hot spots and use them as an estimate of the total N available. Here are the published findings.
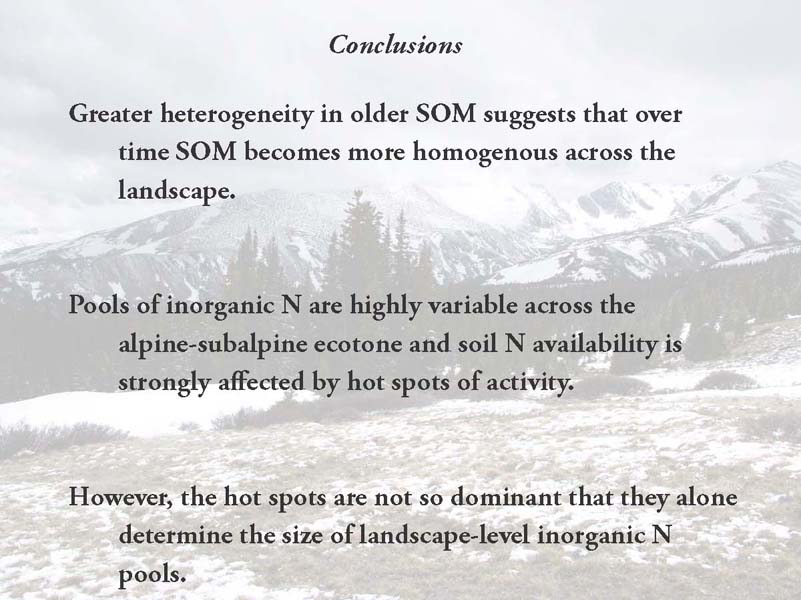
So, here are some conclusions from looking for hot spots in the SOM and inorganic N pools. But what about the locations of the hotspots? Can they be predicted based on other factors?
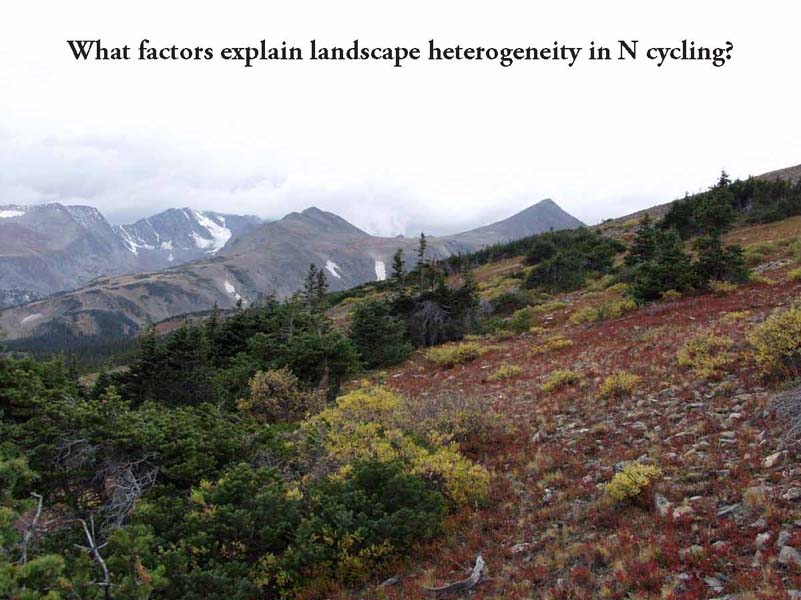
My second major question was about hot spot locations, or, more generally, what factors explain heterogeneity in landscape-level N cycling.
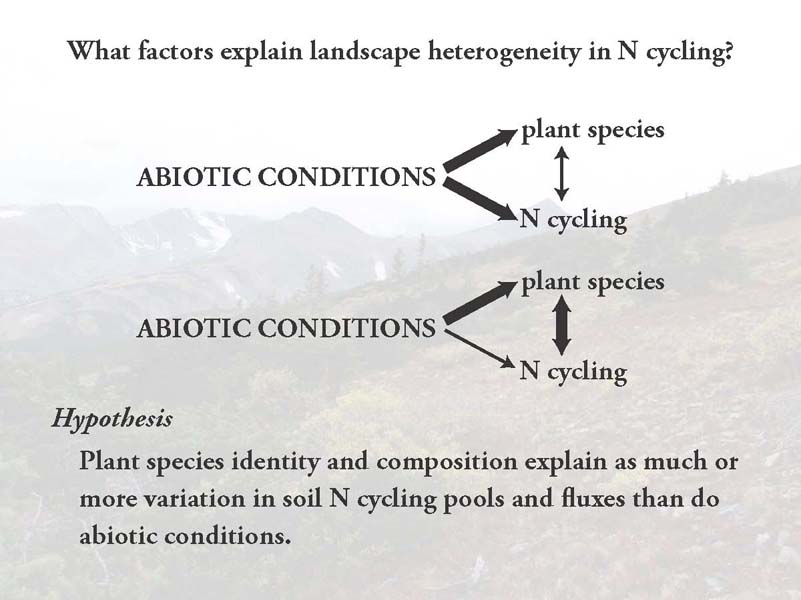
Everyone agrees that in ecosystems with complex terrain, abiotic conditions will be important drivers of plant community composition. The question I had was: Are abiotic conditions controlling BOTH plants and N cycling? --or is it more like-- Once plant communities are established, do they then control the soil N cycle? Based on previous studies of N cycling on Niwot Ridge, I hypothesized that plant species identity was an important driving factor in determining the amount of available inorganic N in any given soil core.

To test this hypothesis, I used random forest regression models. Random forest models are a nonlinear regression-tree-based technique designed to maximize the predictive capability of a set of variables while minimizing overfitting. I used a set of biotic and abiotic predictor variables some of which are shown in the maps above. The main idea was to compare models that include plants with ones that do not include plants.
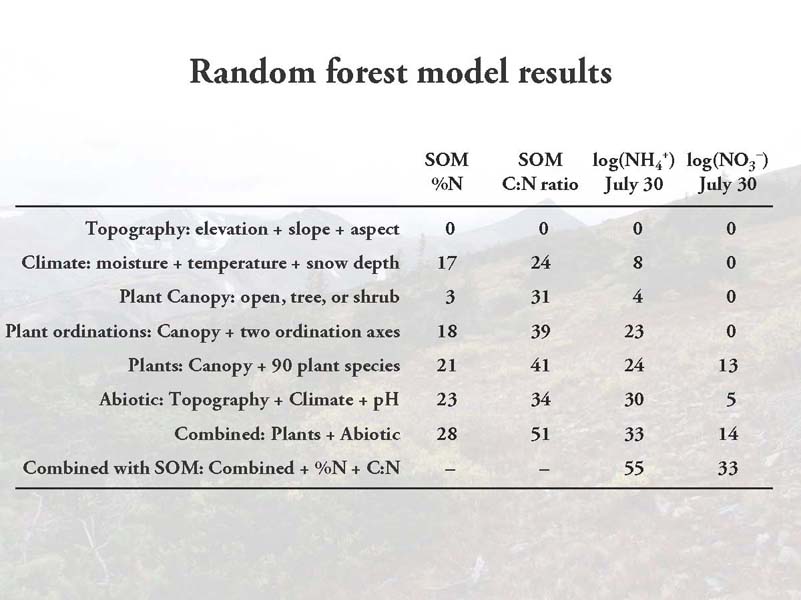
Contrary to my hypothesis, adding plant species identity into the random forest models did not greatly improve their predictive capability. In particular, if you compare the second and third to last rows of the table, you can see some modest but not large improvements. The exception is the SOM C:N ratio, where plant species did seem to improve predictions, though largely just knowing whether samples were in open, tree, or shrub locations was the most useful information. There is some improvement for the NO3– values, but predictive capacity was generally very low for that variable.
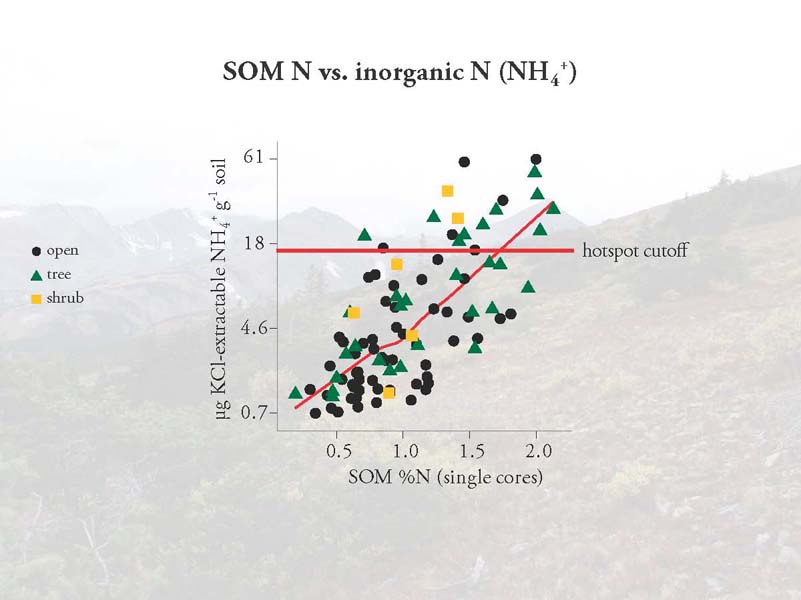
However, the variable that did improve the models and was most useful in predicting hot spot locations was the percentage of nitrogen in the soil organic matter of the cores in which the inorganic N was measured. In particular, soils that had more than 1.4% SOM were much more likely to be hot spots of NH4+ availability.
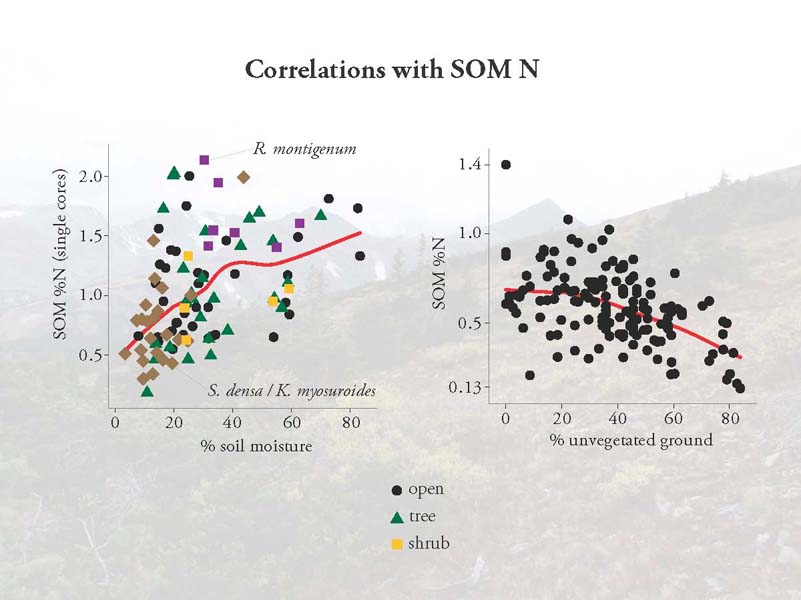
Soil organic matter nitrogen levels are determined by the long-term inputs of organic matter from decaying plants and the long-term outputs of N from leaching and denitrification. Here we see that with more moisture and less unvegetated ground, we have higher soil organic matter N levels. Taken together, these results suggest that plant biomass and activity levels, rather than species identity appear to be more important in understanding hot spot locations. These results are presented in this paper.
Here's another summary of the conclusions.
And a few last ones.
Typically at exit talks in our department, people spend a good amount of time thanking all of the people who helped them with their project. I was grateful for the opportunity to do this myself!
My faculty committee provided great feedback throughout the whole process.
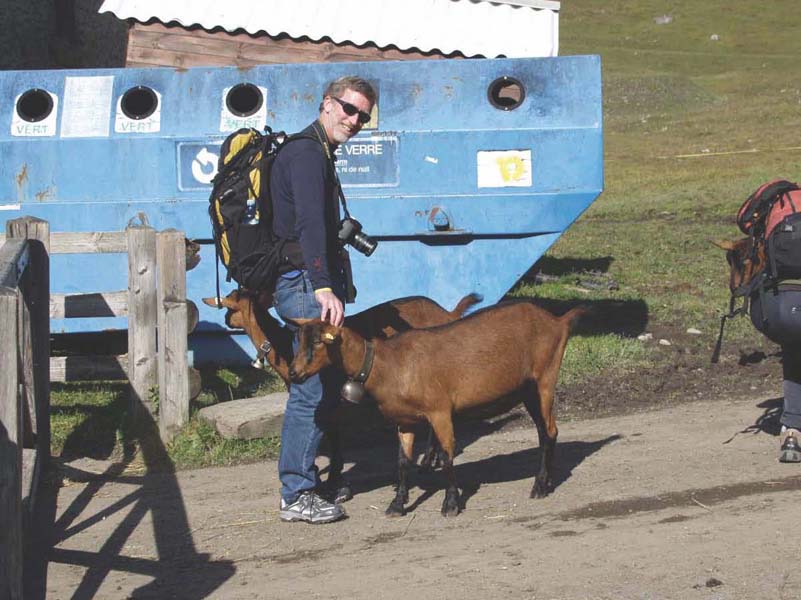
Here's my advisor Bill with some goats in Switzerland! He did a great job advising all of my work.
Lots of generous funding agencies supported my work.
I also had lot of great field help, lab help, and general advice.
Really a ton of people came out for some of my big field days. These were a lot of fun and allowed me to get all of that spatially explicit data in a few long field days. I even found someone randomly on craigslist who wanted to come up to the mountains for a day!

Finally, I had lots of fantastic support from family and friends! Thanks everyone!