Snow survey in the Soddie Watershed 2008: results
April 29, 2008 – 11:04 pm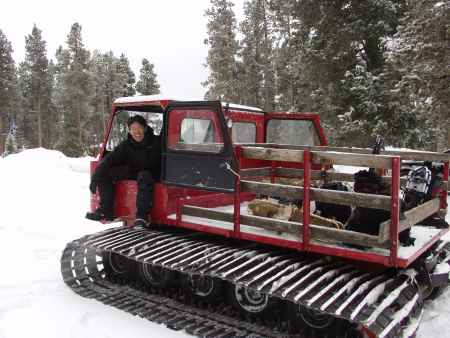
First off, I want to sincerely thank all of the people who helped: Lucas, Andrew, Erik, Brian, Rob, Cherlyn, Bill, Alisa, Jackie, and Mark’s snow class interns who dug some of the snow pits. Lucas deserves special thanks for showing me how to dig the snow pits, driving the snow cat and generally helping me the whole way through, but then again he already received some brewskis for his efforts! Jackie also deserves thanks and praise for making us hella tasty lunches.
With no further ado, the results (depths are in centimeters):

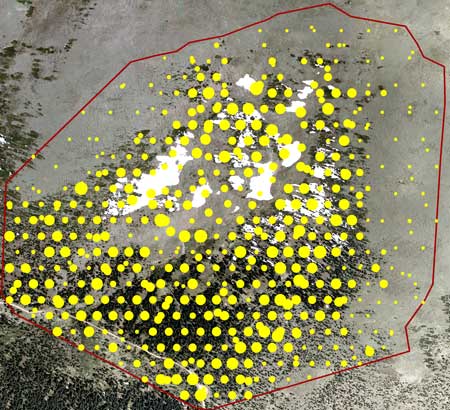
Pretty cool! 501 points, measured by hand over 4 days (3/30/08 – 4/2/08). The trends are pretty clear on the graphic above, but still a few things to notice: 1. The upper alpine dry meadow tundra has very little snow, which means very little N input in those areas. This correlates well with pH and some of the soil C and N numbers (not shown here). 2. Trees are great snow collectors. You can see the buildup, especially in the krummholz (ribbons of stunted windblown trees). 3. The deepest patches and the most variable areas are in the lower krummholz where large cornices form in the ribbons of trees. Those who sampled in those areas can attest to how impressive the cornices are. (Go ahead, let’s see those testimonial comments!) The deepest one I measured was 4.5 m. However, down in the thick forest, the snow is a lot more even, staying in the 1-2 m range.
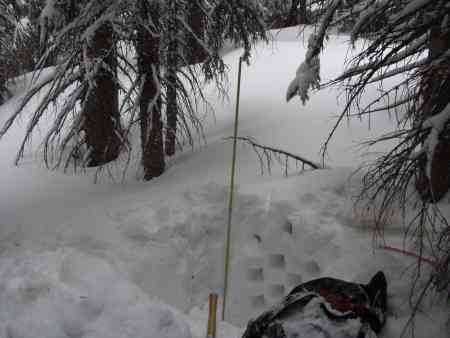
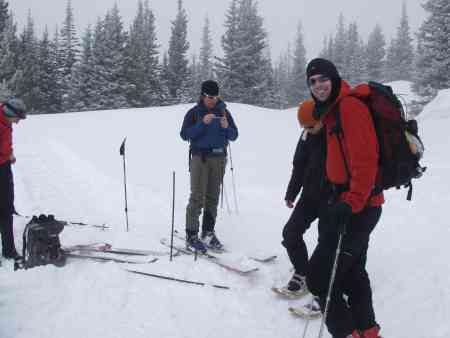
Once I multiply the snow depth by the N concentrations in the snow, I’ll get a good estimate of spatial heterogeneity in wintertime N inputs across the watershed. Those N concentrations are measured by digging snow pits. Here’s a picture of a snow pit I dug. the holes in the pit wall are from the density-measuring procedure.
In addition to showing us where atmospheric nitrogen deposition is melting into ecosystem soils, which was the primary objective here, these data are interesting in the context of a theory called the landscape continuum model (LCM). One of the predictions of the LCM is that through transport by wind and gravity, higher elevation areas subsidize lower elevation areas with water and nutrients. Check out this graphic showing March/April snow on top of July soil moisture:
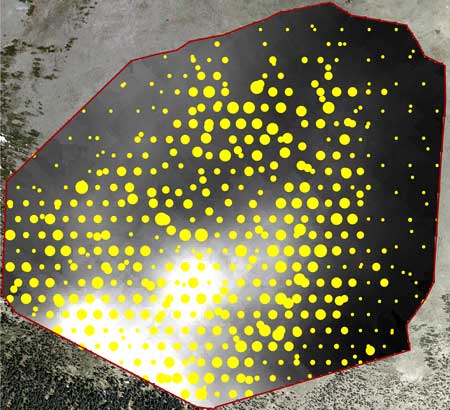
Here we can see the LCM in action. While the snowpack collects in the krummholz, you can see that once it melts out, it collects in the flat toeslope at the bottom of the watershed. When I write this data up for publication, I will attempt to calculate the magnitude of this water subsidy from high ground to low ground. Should be rad.
Anyway, thanks again to all the helpers. It was pretty fun except for the 14 hour days.
6 Responses to “Snow survey in the Soddie Watershed 2008: results”
Good job baby!
By Jaclyn on Apr 30, 2008
Hey Anthony,
I’m impressed! What a feat to collect all those snow depths. I wonder how the N compounds held in the crystalline layers will arrive to the soil surface during melt. For example, what happens if you have a heterogeneous 0.5 ha area of 300cm krummolz drifts, then 60cm depths, then krummulz again and so on. As the snow melts (I assume from the top-down), does the N go straight down vertically to create a hotspot. I would guess that it does, but during big melting events the water is carried across the soil surface as ephemeral streams appear. Does this cause the vegetative heterogeneity to no longer matter with respect to N compounds reaching the soil?
PEACE!
By David Knochel on May 15, 2008
Dave,
Thanks for your comments! Also, great question about the delivery of nitrogen to soils after their buildup in the snow. Research and theory suggest that you are right about the nitrogen delivery not necessarily matching up with snow depths, but not necessarily for the reason that you propose.
The reason that nitrogen will undergo less redistribution than you think is a phenomenon called the ionic pulse. During the cold winter at Niwot Ridge, the snow stays below freezing and ions including nitrogen compounds are immobile within the snowpack. However, when it warms up in spring, the snowpack goes isothermal, meaning that it becomes a consistent 0° C throughout the snow profile. At that time, water begins to trickle through the profile and it takes the ions with it, delivering them all to the soil at once. That is the ionic pulse. Subsequent melting and redistribution of snow then theoretically contains much less nitrogen.
However, there is still a complicating factor. Within the snowpack, there are often ice lenses – bands of hard ice within the snow. When the trickling water hits these lenses, it can then flow horizontally, redistributing the nitrogen, just as you suggested.
The way to measure this – and it wouldn’t be easy – would be to do an application of 15N to the snowpack over a decent-size area (maybe 50 x 50 m) and then try to follow the 15N into the soil during melt.
By Anthony on May 18, 2008
Thanks for the explanation. How prevalent are those ice lenses? Do they occur at an angle parallel with the slope?
By David Knochel on May 20, 2008
Well, when I was digging snow pits, I usually encountered two or three ice layers (each about 1 cm thick) throughout the 1-2 m profile. I don’t know about their horizontal structure though. Sounds like that might be a job for ground penetrating radar. Perhaps Brian Seok will jump in here since he knows more about snow physics.
By Anthony on May 26, 2008
Hey David, ice lenses do occur parallel with the slope. In flat areas, the ice lenses would be in a shape of a typical glass lens (thick in the middle and tappered off at the edges), but on sloped areas, they would be more like a sheet of glass parallel to the slope. I don’t know how prevalent they are though, since I haven’t taken snowpit samples over a large area like Anthony has. But ice lenses would be common–of course–in snowpack with frequent thaw/freeze events like those in Northern Michigan.
By Brian on Jul 14, 2008