Quantifying spatial heterogeneity
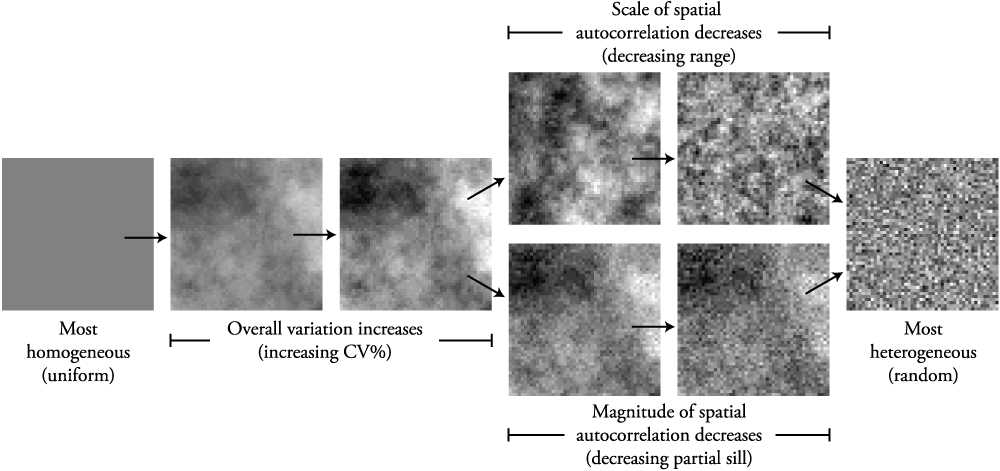
May 4, 2009 – 4:18 pmI’ve thought a lot about quantifying spatial heterogeneity over the course of my dissertation. To demonstrate different types of spatial heterogeneity, I made the graphic below. I originally included this graphic in a draft of a paper that’s part of my dissertation. I’m nixing it for the next draft of the paper since a reviewer complained, saying “These generalized maps can be found in standard textbooks on geostatistics.”
While the reviewer is correct that maps similar to all parts of this figure can be found in various locations, I don’t think it’s true that they have been presented together in this way before. For me this formulation helps in classifying the different kinds of spatial heterogeneity that can be observed. Maybe it will be useful for others too.
Changes in three different types of heterogeneity are shown: overall variation, the magnitude of spatial autocorrelation, and the scale of spatial autocorrelation. Three corresponding metrics can be used for each of these types of variation: the coefficient of variation (CV) as a metric of overall variation, the relative magnitudes of the modeled variogram nugget and sill as a metric of the magnitude of spatial autocorrelation, and the variogram range as a metric of the scale of spatial autocorrelation. The second two types might not make any sense if you are not familiar with geostatistics. If you are curious, I recommend Model Based Geostatistics by Diggle and Ribeiro (2007).
In the figure, heterogeneity increases from left to right. Only one type of heterogeneity is modified for each arrow. In the three simulated grids on the left, the coefficient of variation increases. In the two upper grids, the scale of spatial autocorrelation is reduced while leaving the magnitude constant; vice versa for the two lower grids. Grids are simulated 50 x 50 Gaussian random fields with the same random number seed, which ensures that differences are due only to parameter choices.

2 Responses to “Quantifying spatial heterogeneity”
I really like this figure…would you mind if I used it in my spatial analysis course at Valdosta State University? It would be for educational purposes only…not profit
By Corey Devin Anderson on Dec 27, 2012
Please feel free to use it. Glad you like it.
By Anthony on Dec 27, 2012