Nice splom() wrapper for more informative scatterplot matrices
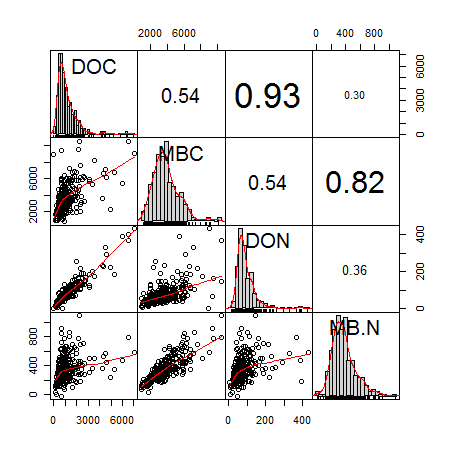
August 27, 2011 – 5:30 pmThanks to this post, I just discovered a great wrapper for splom() called chart.Correlation (package: PerformanceAnalytics), which juices up scatterplot matrices with some nice loess curves, r2 values, and density plots for each variable: pretty much the exact additions I want for every scatterplot matrix I make.
The only thing I don’t like are the significance stars, but it was easy to delete those lines of code and run without them. Here’s an example without the stars for some data I’ve been looking at. The numbers in the upper right boxes are the r2 values and the text in the histogram/densityplot boxes are the variable names.

Sorry, comments for this entry are closed at this time.