REMOTE SENSING OF EARTH'S NITROGEN CYCLE
by Anthony Darrouzet-Nardi · 7 December 2005
"The entire history of science can be read as improvements in information resolution, extending the powers of ten (larger and smaller) with which we can see. Galileo was the first to reach beyond the unaided eye for science with his 20 power telescope. " -- Edward Tufte
1. Introduction
 uman modification of Earth's nitrogen (N) cycle has emerged as one of the most important environmental issues of the new century [Vitousek, et al., 1997]. Thought of in another way, the idea of "human modification of the nitrogen cycle" is a new and more sophisticated, more scientifically rigorous approach to gauging, integrating, and systematizing a number of longstanding environmental issues including pollution, biodiversity, ecosystem health, and ecosystem services. It is an approach which places these environmental issues in the context of the growing field of Earth system science (also sometimes called the biogeosciences). Earth system science is a field that is supported by--and in many ways synthesizes--our well established knowledge bases in Newtonian and quantum physics, organic and inorganic chemistry, and molecular and evolutionary biology. Advances in Earth system science are largely driven by combining technical knowledge from these knowledge bases to produce explanatory and predictive science at regional, continental, and global scales. In this paper, I will discuss the application of remote sensing, one of the most important techniques in Earth system science, to the study of Earth's N cycle. I will discuss the basic ways in which remote sensing has and could be used to learn about the N cycle. Finally, I will discuss how I might be able to make use of remote sensing in my Ph.D. thesis.
Good scholarship can make the difference between fair warning and alarmism. Research on important human environmental issues has often suffered from a lack of rigorous scholarship. Ecologist Robert V. O'Neill put it this way: "Ecology oversold its ability to predict doom and is now seen as unnecessarily constraining to human freedom and economic growth" [O'Neill, 2001]. One of the major challenges to producing rigorous and predictive environmental knowledge has been acquiring information on fine enough spatial and temporal resolution over large enough scales to make societally relevant insights and policy recommendations. Early efforts to scale up using simple mathematical extrapolations were often cursory and inappropriate [e.g., Ehrlich, 1968; Meadows, et al., 1972].
Realizing the shortcomings of the alarmist approach, Earth system scientists have worked to develop a theoretical and technical framework for scaling up knowledge--that is, to extend the powers of ten with which we can see [Levin, 1992; Wiens, 1989]. Of the many techniques developed, remote sensing has emerged as one of the most if not the most valuable technique for scaling up our knowledge of the environment to levels at which it is relevant to ecosystems and human society [Wessman, 1992; Wessman, 2006]. Though remote sensing made its most notable early advances in its application to mineral prospecting, it has now been adapted to a wide range of approaches including the study of biogeochemical cycles and ecophysiology [Inoue, 2003; Schimel, 1995; Sellers and Schimel, 1993; Ustin, et al., 1993]. The role of remote sensing in measuring biogeochemical cycles involves both a direct and an indirect approach. The direct approach is to remotely sense and quantify the biogeochemical elements themselves. This approach is particularly useful for understanding global hydrologic cycling. The indirect approach involves characterizing landscape heterogeneity that correlates in known ways with the element of interest.
2. Earth's nitrogen cycle
The most salient feature of nitrogen on Earth is the effect of its availability on living organisms and the ecosystems they live in. N is an essential element for living organisms because the amino acids that make proteins are nitrogen-rich. For example, the most abundant protein on Earth is likely Rubisco, the enzyme in chloroplasts that catalyzes the initial carbon-fixing reaction of photosynthesis [Stryer, 1995]. In temperate latitudes, N is broadly limiting to primary production; that is, the addition of N fertilizer will nearly always increase NPP [Vitousek and Howarth, 1991]. N availability limits NPP despite the fact that the atmosphere is 80% dinitrogen gas (N2). Atmospheric N2 is unavailable to organisms until it is fixed into a reactive form by N-fixing organisms or by humans.
Currently, human alteration of the N cycle is immense and ecosystems can be expected to respond [Galloway, et al., 2003; Galloway, et al., 2004; Vitousek, 1994; Vitousek, et al., 1997]. Humans fix N for use as fertilizer in agriculture and as a byproduct of fossil fuel combustion. The tremendous benefits of these activities--agriculture and transportation--are accompanied by a number of unintended consequences. Because it is such a key limiting nutrient, changes in the N cycle can drastically change ecosystems. These changes may be manifested as changes in the physiological characteristics of organisms as well as the species composition of communities [Aber, et al., 1989; Bowman, 2000]. In addition to its biological effects as a fertilizer, excess N can also contribute to (1) public health concerns such as unbalanced diets, respiratory ailments, cardiac disease, cancer, allergenic pollen production, and the dynamics of some vector-borne diseases [Townsend, et al., 2003]; (2) ecosystem acidification as nitric acid in precipitation [Aber, et al., 1989; Schindler, et al., 1985; Van Breemen, et al., 1982]; and (3) global warming as nitrous oxide [Houghton, 2001].
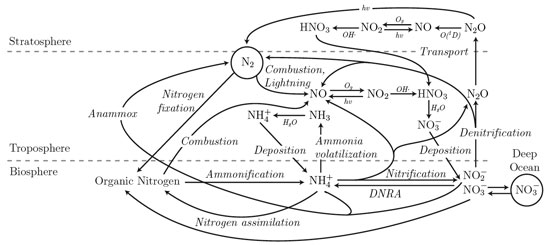
The nitrogen cycle. Chemical species over arrows indicate reaction with that species to effect the transformation. Fixation, ammonification, assimilation, anammox, DNRA, nitrification, and denitrification are enzyme-catalyzed processes.
The nitrogen cycle (above) is inherently complex for several reasons. (1) Due to the large number of oxidation states with which N can bond to other atoms, many small inorganic nitrogen compounds are important and must be accounted for. (2) N is a fairly mobile element in the biosphere because it has many volatile and soluble forms. (3) N is frequently locked up in living tissues and living tissues are organized into complex organisms, populations, and communities. Despite these complexities, there is at least one simplifying feature of the N cycle: The most important reservoir of N on Earth, the N2 in the atmosphere, has very few ins and outs. The only way to fix N is through N-fixing organisms or by high-energy combustion/lightning. Humans have complicated this system by increasing combustion across the globe, both of biomass, and of fossil fuels. However, these fluxes are easier than many other fluxes to estimate [Cleveland, et al., 1999; Galloway, et al., 2004; Gruber and Sarmiento, 1997]. On the other end of the cycle, the only major process that returns reactive nitrogen back to the nonreactive pool of N2 is denitrification, which is performed by several dozen taxa of anaerobic microbes [Knowles, 1982]. Thus, measurements of these processes are particularly valuable. However, for a full perspective on the role of N on ecosystems, we need high-resolution, large-scale data on many parts of the N cycle.
3. Remote sensing of N in the atmosphere
In addition to the 78% of the atmosphere that is dinitrogen gas, N2, many nitrogen compounds exist in the atmosphere. These fall into three major classes: (1) oxidized nitrogen compounds, NOy; (2) reduced nitrogen compounds, ammonia, NH3, and ammonium, NH4+; and (3) the atmospherically stable compound N2O, which has a residence time of ~120 yr. The major oxidized nitrogen compounds include nitric oxide, NO; nitrogen dioxide, NO2; nitric acid, HNO3; and the nitrate ion in aqueous solutions, NO3�. These species tend to be in predictable equilibria with each other [Seinfeld and Pandis, 1998]. Nitrogen also forms a number of other oxidized compounds such as N2O5, the nitrate radical, NO3, and various organic forms including peroxyacetyl nitrate, PAN. Though remote detection of all of these compounds would be desirable for our understanding of the global N cycle, only sensors for several compounds are currently available.
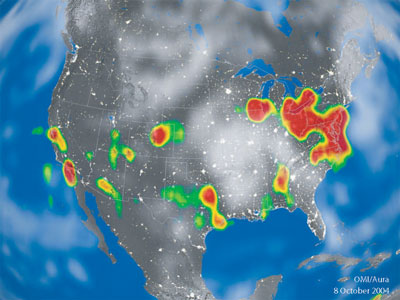
N in the atmosphere is most often remotely sensed as nitrogen dioxide, NO2. Because of the equilibria with other N species, NO2 serves as an indicator of NOx in the atmosphere. Spectrometric measurement of NOx compounds using ground-based methods have been used prior to satellite-based instruments and have become quite sophisticated [e.g., Pujadas, et al., 2000]. With the advent of the Global Ozone Monitoring Experiment (GOME) in 1995, we began to acquire our first high-quality, frequent, global, high-resolution measurements of NOx compounds in the atmosphere. GOME and other projects like it measure the spectral characteristics of the nitrogen compounds using hyperspectral radiometers in the UV and visible. The most recent and best available data appears to come from the Ozone Monitoring Instrument (OMI) on NASA's Aura satellite. OMI has 740 wavelength bands, it measures total ozone profiles as well as profiles of NO2, SO2, and several other chemical species. It covers the earth once per day. To isolate the tropospheric component of the NO2 column, some of these instruments employ limb-nadir matching to subtract out the stratospheric contribution to the column. In other cases, the stratospheric component is subtracted out using modeled estimates.
Predictably, GOME data provided incontrovertible evidence that human-infested urban areas were the primary sources of NOx to the atmosphere, and that our emissions greatly exceeded those from the natural sources of lightning and fire [Beirle, et al., 2004; Boersma, et al., 2005; Choi, et al., 2005 1064]. With several years of data, GOME dramatically improved our estimates of global NOx emissions, including partitioning NOx into lightning, biomass burning, soil, and fossil fuel components [Jaegle, et al., 2005; Martin, et al., 2003]. Aircraft are still used to characterize more precisely the behavior of particular pollution plumes [e.g., Melamed, et al., 2003]. One particularly notable result using GOME data in conjunction with SCIAMACHY data (a more recent European satellite), is the recorded increase in NOx emissions in China in the last ten years with industrialization [Richter, et al., 2005]. In contrast, NOx emissions in Europe and America have dropped due to regulations of pollution. The next generation of satellites, including Aura, will provide even higher spatial and temporal resolution measurements of NO2.
While remote sensing of NO2 is directly relevant for atmospheric scientists concerned about the effects of air pollution on human health, it is still one step removed from the quantity most relevant for ecosystems, the amount of N deposition. The amount of N that is deposited into ecosystems from the atmosphere is difficult to estimate. N can be deposited as either wet or dry deposition. Wet deposition depends on knowing the local precipitation and concentration amounts of NO2. This may be impossible on a remote sensing platform because clouds obscure the UV and visible sensors. Dry deposition is even more difficult to calculate as it relies on factors such as local wind and boundary conditions as well as vegetation structure [Seinfeld and Pandis, 1998; Sievering, 2001].
To make measurements of N relevant to our understanding of ecosystem dynamics, remotely sensed atmospheric NO2 must be used in combination with geospatially interpolated ground data such as the wet deposition numbers measured by the National Acid Deposition Program [NADP/NTN, 2002] and, for total-including-dry deposition, modeled estimates of N deposition [e.g. Fenn, et al., 2003]. Comparing the satellite-derived NO2 data to the NADP data shows that enhanced levels of deposition occur over a much wider area than the NO2 plumes cover. This shows that N is transported farther in the atmosphere as it becomes more and more oxidized. Modeled estimates that include dry deposition also point out large gaps in N addition to ecosystems as calculated by the NADP wet deposition data. For example, the Los Angeles basin has some of the highest levels of N deposition in the country, almost all of which is dry deposition. The remotely sensed data provides a useful constraint by showing areas that have high inputs of NOx that do not register in the NADP network.
Methods for remote sensing of N2O, HNO3, and NO3 are much less developed than methods for measuring NO2, but development is occurring. Methods for measuring N2O have not been used extensively, but have helped to constrain estimates of stratospheric N2O in polar regions [Kanzawa, et al., 2003]. Because N2O is long-lived (residence time ~120 yr), measurements at high temporal resolution are not as important as for NO2 since they can be measured at high-altitude sites such as Mauna Loa. New algorithms, instruments, and satellites will likely increase our ability to remotely sense N2O in the future [Lubrano, et al., 2004; Urban, et al., 2005]. Measurement of HNO3 is important for our understanding of atmospheric N deposition to ecosystems. Some work has been done on measuring atmospheric HNO3 using aircraft [Hopfner, et al., 1998], but little work has been done using satellites beyond exploratory tests of instrument capabilities [Cazzoli, et al., 2005; Tso and Leu, 1996]. Finally, methods for partitioning of oxidized nitrogen compounds into the various NOy species and understanding the chemistry between them have been attempted, but are also in nascent stages of development [Stowasser, et al., 2002]. I am not aware of any efforts to remotely sense reduced nitrogen compounds, though this would doubtless illuminate the agricultural contribution to global increases in reactive nitrogen.
4. Remote sensing of N in the ocean
One of the most dramatic examples of human alteration of the N cycle is the global increase in toxic algal blooms, or red tides [Hallegraeff, 1993]. The algae that bloom are stimulated by the nutrient-rich effluents that flow into the ocean. Red tides most often occur near the mouths of major rivers that drain highly fertilized agricultural areas such as the Mississippi River delta and the Baltic and Black seas. Red tides are part of a broader phenomenon, coastal eutrophication. Growth of the biota in the oceans is limited by various nutrients, N among them [Vitousek and Howarth, 1991]. Thus, coastal eutrophication can occur as the result of any type of N input. In addition to river inputs, atmospheric inputs are also important for coastal eutrophication [Paerl, 1993]. Because the addition of N increases biotic activity by alleviating limitation, and because increased biotic activity changes the color of the ocean in well-known ways, we can use remote sensing to examine biotic activity as a proxy for nutrient input. For example, a recently developed technique that gives high-resolution, high-quality information on red tides is the use of MODIS-derived chlorophyll concentrations and fluorescence line heights [Hu, et al., 2005]. Remote sensing has played an important role in documenting the extent and timing of red tides and coastal eutrophication. The relative homogeneity of the ocean relative to land makes remotely sensed measurements such as these essential for our understanding of global biogeochemical cycles.
There is also a more direct method of acquiring N concentrations from the ocean. Carbon and nitrogen cycles are strongly coupled through photosynthesis because the biochemical photosynthetic machinery in autotrophs is N-rich. Since solar irradiance on the ocean increases both photosynthesis and sea surface temperature, sea surface temperature is tightly correlated with nitrate levels in the ocean [Strickland, 1967]. Sea surface temperature is routinely measured using instruments such as the Advanced Very High Resolution Radiometer (AVHRR) and Advanced Microwave Scanning Radiometer AMSR. Data from these instruments can be combined with data collected from ocean-borne research vessels as well as remotely sensed measures of chlorphyll abundance and used to estimate nitrate concentrations [Dugdale, et al., 1997; Switzer, et al., 2003]. This approach can be used to estimate so-called "new production." New production is the fraction of primary production that does not rely on locally recycled N in the form of ammonium. Measurements of new production are important for predicting (1) higher-trophic level ecological dynamics, including those of economically important fish species; and (2) rates of carbon sequestration, which is important because the ocean is a long-term carbon sink. Finally, at least one study has expanded upon this technique using more data from ocean-borne research vessels to make inferences about the community structure in phytoplankton community structure [Kamykowski and Zentara, 2003].
In addition to nitrate concentrations, we can also use remotely sensed data to acquire useful information about natural N fixation inputs to ocean. The most important organisms for N fixation in the open ocean are Trichodesmium spp. At high concentrations, we can measure the remotely sense the amount of chlorophyll that is in Trichodesmium in particular. By combining satellite-measured concentrations of Trichodesmium chlorophyll concentrations in the ocean with ship-measured biomass profiles of Trichodesmium, we can estimate rates of N fixation [Coles, et al., 2004; Hood, et al., 2002]. This technique is still being developed and has several complexities, such as the limitation to detecting only high concentrations of Trichodesmium that will have to be overcome before we can make solid, spatially explicit estimates of N fixation in oceans.
5. Remote sensing of N on land
Compared with the ocean, N cycling on land is much more heterogeneous. The primary task in scaling up biogeochemical cycles including N cycles is overcoming this heterogeneity. Furthermore, most N cycling on land occurs in locations that are not detectable using remote sensing, including belowground in soils and inside opaque organisms. The main remote sensing technique that has provided information on terrestrial N cycling is imaging spectroscopy, also called hyperspectral imaging [Goetz and Curtiss, 1996; Goetz, et al., 1985]. Imaging spectrometry is one of the most profound techniques for understanding patterns on the surface of Earth ever discovered. One sensor in particular has been used most often for remote sensing of foliar N and other aspects of N cycling, the Airborne Visible/Infrared Imaging Spectrometer [AVIRIS, Vane and Goetz, 1993].
Since most N cycling processes are not directly observable with remote sensing, the utility of hyperspectral data is in estimating landscape features such as land cover, water quantities, or canopy chemistry, and then correlating these with field measurements of the unobservable N pools or fluxes. In theory, this approach can also be carried out using multispectral data in combination with plot-scale data or computer modeling, which I will discuss. I will describe the factors that are necessary to consider when measuring terrestrial N cycling using remote sensing and review recent findings from agricultural and natural ecosystems.
The first study to apply hyperspectral imaging to the determination of regional-level N cycling was Wessman et al. [1988]. This study used the progenitor to AVIRIS, the Airborne Imaging Spectrometer [AIS, Goetz, et al., 1985]. The AIS was used to estimate lignin concentrations in the canopy, which was known to correlate with N mineralization rates. This makes sense since the lignin:N ratio typically correlates with decomposition rate due to the slow pace at which microbes tend to metabolize the irregularly bonded saccharide monomers in lignin compounds. The study examined a forest in Wisconsin and produced both a spatially explicit image estimating mineralization, showing how it differed under different types of stands, as well as estimates of total N mineralization.
While Wessman et al. [1988] used estimates of canopy lignin to estimate N cycling rates, perhaps the most useful variable to correlate with N cycling processes in terrestrial ecosystems is foliar N. Foliar N is the only pool of terrestrial N (aside from those in the atmosphere) that can be measured directly with remote sensing. There are many factors to consider when measuring foliar N using remote sensing. The first step in understanding foliar N is to understand how leaves reflect light under various conditions. Much of this exploratory work has been done in agricultural and forest ecosystems for two reasons: The first reason is that the lower degree of heterogeneity of the planted ecosystems and monotypic forests simplifies the analysis. The second reason directly relates to nitrogen. Due to the environmental concerns of excess loading of reactive N in ecosystems, agricultural researchers have been interested in developing "precision agriculture" techniques [Boggs, et al., 2003; Scharf, et al., 2002]. If farmers and foresters can know exactly which parts of their fields need N and when they need it, far less N can be applied to the fields, dramatically reducing leaching and volatilization of excess N [Matson, et al., 1996].
Agricultural studies of foliar chemistry, including N content, have been crop specific, including studies on corn [Bausch and Duke, 1996; Schlemmer, et al., 2005], cotton [Zhao, et al., 2004], wheat [Ayala-Silva and Beyl, 2005], pine trees [Goodwin, et al., 2005], giant sequoias [Gong, et al., 2002], potatoes, and apples [Davenport, et al., 2003]. These studies have shown a number of correlations between various parts of the reflected spectrum and leaf nitrogen status. Leaves that are stressed tend to have lower chlorophyll concentrations, which causes an increase in reflectance in the visible and the infrared (IR). The so-called "red edge" also tends to shift with foliar N content. The red edge is the wavelength of the maximum slope during the increase in reflectance going from the red to the near infrared (NIR). These studies have also searched for various indices that can be applied using multispectral data. Zhao [2005] appears to have found such an index for winter wheat in China using LANDSAT TM band 5. However, this is the exception; no one particular index has been converged upon that applies to many taxa. For single-taxon agricultural applications, a common and fairly effective approach has been the use of discriminant analyses to separate patches of the target crop grown under different fertilizer regimes [Karimi, et al., 2005; Zhao, et al., 2004]. It seems likely that given sufficient availability of hyperspectral data, farmers could manage their N input much more easily, with many environmental benefits. Finally, perhaps the most consistent and important finding of these studies is that leaf-level information is an important first step, but is not adequate for the interpretation of remotely sensed data; many other important variables contribute to the ground reflectance of a landscape [Johnson, 2001; Johnson and Billow, 1996].
Armed with data on the spectral properties of leaves, the next step in acquiring spatially explicit regional-level data on foliar N is to factor in the other contributing sources of reflected radiation on the landscape, including soil contribution and angles of the interacting ground and satellite components. This has been approached from a theoretical perspective as well as an empirical statisical perspective [Asner, 1998; Asner, et al., 1998b; Dawson, et al., 1999; Peterson, et al., 1988]. As with validation of other vegetation indices [Myneni, et al., 1995], an effective approach to interpreting hyperspectral data with respect to foliar N has been to carefully examine the data using various statistical variance-partitioning procedures [Curran, 1989; Gao and Goetz, 1994, 1995]. Measurements of foliar N work best in closed canopies, where the soil contribution to the signal does not overwhelm the leaves. Ground-truthing at the time of measurement is necessary for these techniques to provide accurate data. Overall, the techniques work well for many systems, especially forests. Currently, the biggest limitation to widespread application of these techniques is the cost of acquiring hyperspectral imagery.
One additional concern that has arisen in measuring foliar N has been the vertical variation of foliar N within the canopy. This issue has been addressed in both natural [O'Neill, et al., 2002] and agricultural [O'Neill, et al., 2002] ecosystems. While there is a well known increase in foliar N with increasing canopy height [Lambers, et al., 1998], these studies conclude that this is not a serious problem for remote sensing of N. Integrative measures of the remotely sensed top layer of the canopy appear to be sufficent to estimate total foliar N in the canopy.
Considering the excitement generated by Wessman et al. (1988), the number of studies since then that have applied these techniques has been relatively modest. I found around a dozen that have used hyperspectral data (usually AVIRIS) since then. I will briefly summarize them here. As far as I can tell, the first major project with AVIRIS was work done on a transect of froest stands in Oregon [Johnson, et al., 1994]. This study focused on matching biochemical constituents of the canopy with collected AVIRIS data. The first application in agriculture was on rice fields in California [LaCapra, et al., 1996], in which moderately good correlations were found between the hyperspectral data and field-measured foliar chemistry.
The most substantial research efforts in remote sensing of N, including the Wessman et al. (1988) paper have been done by a research group at the University of New Hampshire. They first established that AVIRIS data could be used for measuring N cycling. [Martin and Aber, 1997]. They went on to examine correlations between AVIRIS-predicted foliar N data and soil C:N ratios [Ollinger, et al., 2002]. Soil C:N ratios were fairly well correlated with the hyperspectral data, but the ground-truthing effort was not comprehensive enough to determine the exact strengths and weaknesses of this approach. Soil C:N is particularly valuable for understanding N cycling in these forests because values below 22 suggest that nitrification (microbial respiration of NH4+, producing NO3�) is occurring. This group has also put effort into understanding the coupling of the carbon and nitrogen cycles by examining the relationship between foliar N and primary production [Smith, et al., 2002].
The New Hampshire group and several others have tested some of these methods using the only spaceborne imaging spectrometer, Hyperion [Coops, et al., 2003; Smith, et al., 2003], and a new airborne spectrometer, the Airborne Visible near Infrared Imaging Spectrometer [AVIS, Oppelt and Mauser, 2004]. Neither of these sensors function as well as AVIRIS, but they do help to alleviate the bottleneck of data acquisition in applying these techniques. Serrano [2002] examined chaparral vegetation in southern California and attempted to derive NDVI-like indices for N based on hyperspectral data.
One final study of foliar N deserves particular attention. Asner and Vitousek [2005] describe in the supplementary methods of their paper, how they used AVIRIS (which has recently been fitted with higher quality optics to reduce signal to noise ratios) to estimate canopy N and water content in Hawaiian forests. They used an approach that they called the photon transport inverse modeling approach, which takes the biophysical and biochemical features of their system of interest and models how photons of different wavelengths ought to interact with the canopy. They then compared this to the hyperspectral data collected using AVIRIS. The important variables they examined were leaf reflectance and transmittance, leaf area index, leaf area density, intercrown gap fraction, and solar and sensor zenith and azimuth angles. Further, the leaf spectral reflectance and transmittance were modeled as a function of equivalent water thickness, specific leaf area (leaf mass/area), and various constituents of the leaf which were of target interest: pigments, nitrogen, cellulose, and lignin. With the extremely high quality AVIRIS data, they were able to get correlations with shotgun-collected field data of ~90%. They found that the best predictors of leaf N were the chlorophyll absorption bands (460-480 nm and 650-670) as well as the protein-nitrogen bands at 1,510-1790 nm, even though the protein bands are partially masked by the effects of leaf water. This is fairly amazing and may open up new possibilities for very precise measurements using these techniques. Another similar study by the same research group demonstrated the use of these techniques for examining foliar phosphorus and overall nutrient availabilty [Porder, et al., 2005].
Aside from foliar N, the second-most important variable that correlates with N cycling process in ecosystems is landcover. In arid and semiarid shrublands, biotic activity tends to be concentrated under shrubs [Schlesinger, et al., 1996]. Thus, shrub cover, which can often be estimated using spectral mixture analysis of hyperspectral data is a potent predictor of N cycling processes [Asner, et al., 1998a; Martin and Asner, 2005]. For larger scale land conversions, such as conversion of tropical rain forests to pastures, multispectral data from land use satellites may be valuable for very large scale estimates of changes in N biogeochemistry [Asner, et al., 2004]. Hyperspectral data may also have enough information to determine species composition within a single landcover type [Martin and Aber, 1997; Pontius, et al., 2005]. Since belowground N cycling is known to show large differences under different plant species [Steltzer and Bowman, 1998], assessments of species composition in moderately diverse ecosystems may be the best approach to developing spatially explicit, landscape level information about N cycling.
6. Application to my thesis
My main interest is scaling up measurements of N cycling to understand how terrestrial ecosystems will process the large quantities of anthropogenic N input. Toward this end, I am most interested in correlating hyperspectral data with N cycling processes. My research will examine the effects of a regional-scale anthropogenic impact, atmospheric N deposition, on a well-studied ecosystem, the Niwot Ridge LTER site in the Front Range of the Rocky Mountains. A half century of research on Niwot Ridge has lead to a quantitative understanding of the factors that create landscape pattern at different scales [Bowman and Seastedt, 2001]. The role of N in structuring the Niwot Ridge landscape has received special attention since it is a limiting resource for production [Bowman, et al., 1993] and since N deposition from fossil fuel combustion and agricultural sources is creating measurable change in Rocky Mountain ecosystems [Baron, et al., 2000]. Thus, Niwot Ridge is an ideal research environment in which to investigate N cycling, reconcile data collected at different scales, and work towards an understanding of how ecosystems process N deposition at larger scales.
As shown above, most research on remote sensing of N cycling has focused on measuring foliar N and correlating it with other N cycling processes. Due to the diversity of species on Niwot Ridge and incomplete species cover in some plant assemblages [Walker, et al., 2001], estimating foliar N may be difficult on Niwot Ridge. Moisture is also an important correlate with N cycling processes such as nitrification, denitrification, and mineralization; however, measurements of moisture would have to be taken frequently to fully characterize the water environment. On the other hand, in many cases, the plant cover and plant species composition are strongly correlated with N cycling processes [Fisk, et al., 1998; Steltzer and Bowman, 1998]. Hyperspectral data may be used to get multi-variable data on heterogeneity on Niwot Ridge, which could then be correlated with field measurements of N cycling.
I believe that to get the most information out of hyperspectral data, it must be coupled with field campaigns that are more comprehensive than what has been done to date. The best example of this approach is Asner [1998a], but this method has only begun to be explored. At Niwot Ridge, I would like to take advantage of the proximity of the field site and advances in batch processing of field samples to adequately characterize the N cycling patterns on Niwot Ridge. Though I won't know whether correlation of these field results with hyperspectral data would really work until I look at some hyperspectral data and make some preliminary field measurements with a spectrometer, I believe that the method is worth investigating. Using existing plot-scale data to inform and complement answers to larger-scale questions is an important challenge in ecology. N deposition is a growing environmental concern in temperate ecosystems. I hope that my research will benefit our understanding of this global change phenomenon in other ecosystems as well as contribute to methods for generating ecological insight at larger scales.
7. Conclusion
A major theme in this paper is that N does not have to be sensed directly to understand N cycling. N cycling is intimately entwined with the organisms, including humans, that process it. Many times, the measurement of landscape heterogeneity that can then be correlated with N cycling processes, is the most useful role for remote sensing in understanding the N cycle. While the advantages of quantifying heterogeneity are most important on land, they are also important in the ocean. Correlations with ocean currents and colors is already providing high quality information about N cycling in the oceans. Likewise, the atmospheric portion of the cycle has the advantage of our being able to make direct measurement of N compounds. Our abilities to measure N in the atmosphere are improving rapidly, largely due to remotely sensed data. Because of the strong connections between biogeochemical cycles on the entire Earth, the easier-to-measure values in the ocean and in the atmosphere will help to constrain estimates of N cycling on land. Ultimately, I both hope and predict that knowledge of N cycling will extend to the proper scale and resolution and allow us to develop better environmental policy that benefits human society.
References
Aber, J. D., et al. (1989), Nitrogen Saturation in Northern Forest Ecosystems, Bioscience, 39, 378-386.
Asner, G. P. (1998), Biophysical and biochemical sources of variability in canopy reflectance, Remote Sensing Of Environment, 64, 234-253.
Asner, G. P., et al. (2004), Pasture degradation in the central Amazon: linking changes in carbon and nutrient cycling with remote sensing, Glob. Change Biol., 10, 844-862.
Asner, G. P., and P. M. Vitousek (2005), Remote analysis of biological invasion and biogeochemical change, Proceedings Of The National Academy Of Sciences Of The United States Of America, 102, 4383-4386.
Asner, G. P., et al. (1998a), Heterogeneity of savanna canopy structure and function from imaging spectrometry and inverse modeling, Ecological Applications, 8, 1022-1036.
Asner, G. P., et al. (1998b), Variability in leaf and litter optical properties: Implications for BRDF model inversions using AVHRR, MODIS, and MISR, Remote Sensing Of Environment, 63, 243-257.
Ayala-Silva, T., and C. A. Beyl (2005), Changes in spectral reflectance of wheat leaves in response to specific macronutrient deficiency, in Space Life Sciences: Ground-Based Iron-Ion Biology And Physics, Including Shielding, edited, pp. 305-317.
Baron, J. S., et al. (2000), Ecosystem responses to nitrogen deposition in the Colorado Front Range, Ecosystems, 3, 352-368.
Bausch, W. C., and H. R. Duke (1996), Remote sensing of plant nitrogen status in corn, Transactions Of The Asae, 39, 1869-1875.
Beirle, S., et al. (2004), NOx production by lightning estimated with GOME, in Trace Constituents In The Troposphere And Lower Stratosphere, edited, pp. 793-797.
Boersma, K. F., et al. (2005), Estimates of lightning NOx production from GOME satellite observations, Atmospheric Chemistry And Physics, 5, 2311-2331.
Boggs, J. L., et al. (2003), Relationship between hyperspectral reflectance, soil nitrate-nitrogen, cotton leaf chlorophyll, and cotton yield: A step toward precision agriculture, Journal Of Sustainable Agriculture, 22, 5-16.
Bowman, W. D. (2000), Biotic controls over ecosystem response to environmental change in alpine tundra of the Rocky Mountains, Ambio, 29, 396-400.
Bowman, W. D., and T. R. Seastedt (Eds.) (2001), Structure and function of an alpine ecosystem: Niwot Ridge, Colorado, xiii, 337 p. pp., Oxford University Press, Oxford; New York.
Bowman, W. D., et al. (1993), Constraints of Nutrient Availability on Primary Production in 2 Alpine Tundra Communities, Ecology, 74, 2085-2097.
Cazzoli, G., et al. (2005), Experimental determination of air-broadening parameters of pure rotational transitions of HNO3: intercomparison of measurements by using different techniques, Journal Of Molecular Spectroscopy, 229, 158-169.
Choi, Y., et al. (2005), Evidence of lightning NOx and convective transport of pollutants in satellite observations over North America, Geophysical Research Letters, 32.
Cleveland, C. C., et al. (1999), Global patterns of terrestrial biological nitrogen (N-2) fixation in natural ecosystems, Global Biogeochemical Cycles, 13, 623-645.
Coles, V. J., et al. (2004), Remote sensing of new production fuelled by nitrogen fixation, Geophysical Research Letters, 31.
Coops, N. C., et al. (2003), Prediction of eucalypt foliage nitrogen content from satellite-derived hyperspectral data, Ieee Transactions On Geoscience And Remote Sensing, 41, 1338-1346.
Curran, P. J. (1989), Remote-Sensing Of Foliar Chemistry, Remote Sensing Of Environment, 30, 271-278.
Davenport, I. J., et al. (2003), The use of earth observation techniques to improve catchment-scale pollution predictions, Physics And Chemistry Of The Earth, 28, 1365-1376.
Dawson, T. P., et al. (1999), The propagation of foliar biochemical absorption features in forest canopy reflectance: A theoretical analysis, Remote Sensing Of Environment, 67, 147-159.
Dugdale, R. C., et al. (1997), Assessment of new production at the upwelling center at Point Conception, California, using nitrate estimated from remotely sensed sea surface temperature, Journal Of Geophysical Research-Oceans, 102, 8573-8585.
Ehrlich, P. R. (1968), The population bomb, 223 p. pp., Ballantine Books, New York.
Fenn, M. E., et al. (2003), Nitrogen emissions, deposition, and monitoring in the western United States, Bioscience, 53, 391-403.
Fisk, M. C., et al. (1998), Topographic patterns of above- and belowground production and nitrogen cycling in Alpine tundra, Ecology, 79, 2253-2266.
Galloway, J. N., et al. (2003), The nitrogen cascade, Bioscience, 53, 341-356.
Galloway, J. N., et al. (2004), Nitrogen cycles: past, present, and future, Biogeochemistry, 70, 153-226.
Gao, B. C., and A. F. H. Goetz (1994), Extraction Of Dry Leaf Spectral Features From Reflectance Spectra Of Green Vegetation, Remote Sensing Of Environment, 47, 369-374.
Gao, B. C., and A. F. H. Goetz (1995), Retrieval Of Equivalent Water Thickness And Information Related To Biochemical-Components Of Vegetation Canopies From Aviris Data, Remote Sensing Of Environment, 52, 155-162.
Goetz, A. F. H., and B. Curtiss (1996), Hyperspectral imaging of the Earth: Remote analytical chemistry in an uncontrolled environment, Field Analytical Chemistry And Technology, 1, 67-76.
Goetz, A. F. H., et al. (1985), Imaging Spectrometry For Earth Remote-Sensing, Science, 228, 1147-1153.
Gong, P., et al. (2002), Analysis of in situ hyperspectral data for nutrient estimation of giant sequoia, International Journal Of Remote Sensing, 23, 1827-1850.
Goodwin, N., et al. (2005), Assessing plantation canopy condition from airborne imagery using spectral mixture analysis and fractional abundances, International Journal Of Applied Earth Observation And Geoinformation, 7, 11-28.
Gruber, N., and J. L. Sarmiento (1997), Global patterns of marine nitrogen fixation and denitrification, Global Biogeochemical Cycles, 11, 235-266.
Hallegraeff, G. M. (1993), A Review Of Harmful Algal Blooms And Their Apparent Global Increase, Phycologia, 32, 79-99.
Hood, R. R., et al. (2002), Remote estimation of nitrogen fixation by Trichodesmium, Deep-Sea Research Part Ii-Topical Studies In Oceanography, 49, 123-147.
Hopfner, M., et al. (1998), HNO3 and PSC measurements from the TRANSALL: Sequestering of HNO3 in the winter of 1994/95, Journal Of Atmospheric Chemistry, 30, 61-79.
Houghton, J. T. (2001), Climate change 2001: the scientific basis: contribution of Working Group I to the third assessment report of the Intergovernmental Panel on Climate Change, x, 881 p. pp., Cambridge University Press, Cambridge; New York.
Hu, C. M., et al. (2005), Red tide detection and tracing using MODIS fluorescence data: A regional example in SW Florida coastal waters, Remote Sensing Of Environment, 97, 311-321.
Inoue, Y. (2003), Synergy of remote sensing and modeling for estimating ecophysiological processes in plant production, Plant Production Science, 6, 3-16.
Jaegle, L., et al. (2005), Global partitioning of NOx sources using satellite observations: Relative roles of fossil fuel combustion, biomass burning and soil emissions, Faraday Discussions, 130, 407-423.
Johnson, L. F. (2001), Nitrogen influence on fresh-leaf NIR spectra, Remote Sensing Of Environment, 78, 314-320.
Johnson, L. F., and C. R. Billow (1996), Spectrometric estimation of total nitrogen concentration in Douglas-fir foliage, International Journal Of Remote Sensing, 17, 489-500.
Johnson, L. F., et al. (1994), Multivariate-Analysis Of Aviris Data For Canopy Biochemical Estimation Along The Oregon Transect, Remote Sensing Of Environment, 47, 216-230.
Kamykowski, D., and S. J. Zentara (2003), Can phytoplankton community structure be inferred from satellite-derived sea surface temperature anomalies calculated relative to nitrate depletion temperatures? Remote Sensing Of Environment, 86, 444-457.
Kanzawa, H., et al. (2003), Validation and data characteristics of nitrous oxide and methane profiles observed by the Improved Limb Atmospheric Spectrometer (ILAS) and processed with the Version 5.20 algorithm, Journal Of Geophysical Research-Atmospheres, 108.
Karimi, Y., et al. (2005), Discriminant analysis of hyperspectral data for assessing water and nitrogen stresses in corn, Transactions Of The Asae, 48, 805-813.
Knowles, R. (1982), Denitrification, Microbiological Reviews, 46, 43-70.
LaCapra, V. C., et al. (1996), Remote sensing of foliar chemistry of inundated rice with imaging spectrometry, Remote Sensing Of Environment, 55, 50-58.
Lambers, H., et al. (1998), Plant physiological ecology, xxvii, 540 p. pp., Springer, New York.
Levin, S. A. (1992), The problem of pattern and scale in ecology, Ecology, 73, 1943-1967.
Lubrano, A. M., et al. (2004), Retrieving N2O from nadir-viewing infrared spectrometers, Tellus Series B-Chemical And Physical Meteorology, 56, 249-261.
Martin, M. E., and J. D. Aber (1997), High spectral resolution remote sensing of forest canopy lignin, nitrogen, and ecosystem processes, Ecological Applications, 7, 431-443.
Martin, R. E., and G. P. Asner (2005), Regional estimate of nitric oxide emissions following woody encroachment: Linking imaging spectroscopy and field studies, Ecosystems, 8, 33-47.
Martin, R. V., et al. (2003), Global inventory of nitrogen oxide emissions constrained by space-based observations of NO2 columns, Journal Of Geophysical Research-Atmospheres, 108.
Matson, P. A., et al. (1996), Fertilization practices and soil variations control nitrogen oxide emissions from tropical sugar cane, Journal Of Geophysical Research-Atmospheres, 101, 18533-18545.
Meadows, D. H., et al. (1972), The Limits to Growth: A Report for the Club of Rome's Project on the Predicament of Mankind, Signet, New America Library, New York.
Melamed, M. L., et al. (2003), Measuring reactive nitrogen emissions from point sources using visible spectroscopy from aircraft, Journal Of Environmental Monitoring, 5, 29-34.
Myneni, R. B., et al. (1995), The Interpretation Of Spectral Vegetation Indexes, Ieee Transactions On Geoscience And Remote Sensing, 33, 481-486.
NADP/NTN (2002), National Atmospheric Deposition Program (NRSP-3)/National Trends Network database (http://nadp.sws.uiuc.edu), NADP Program Office, Illinois State Water Survey, Champaign, IL.
O'Neill, A. L., et al. (2002), Biochemical and reflectance variation throughout a Sitka spruce canopy, Remote Sensing Of Environment, 80, 134-142.
O'Neill, R. V. (2001), Is it time to bury the ecosystem concept? (With full military honors of course!), Ecology, 82, 3275-3284.
Ollinger, S. V., et al. (2002), Regional variation in foliar chemistry and N cycling among forests of diverse history and composition, Ecology, 83, 339-355.
Oppelt, N., and W. Mauser (2004), Hyperspectral monitoring of physiological parameters of wheat during a vegetation period using AVIS data, International Journal Of Remote Sensing, 25, 145-159.
Paerl, H. W. (1993), Emerging Role Of Atmospheric Nitrogen Deposition In Coastal Eutrophication - Biogeochemical And Trophic Perspectives, Canadian Journal Of Fisheries And Aquatic Sciences, 50, 2254-2269.
Peterson, D. L., et al. (1988), Remote-Sensing Of Forest Canopy And Leaf Biochemical Contents, Remote Sensing Of Environment, 24, 85-&.
Pontius, J., et al. (2005), Using AVIRIS to assess hemlock abundance and early decline in the Catskills, New York, Remote Sensing Of Environment, 97, 163-173.
Porder, S., et al. (2005), Ground-based and remotely sensed nutrient availability across a tropical landscape, Proceedings Of The National Academy Of Sciences Of The United States Of America, 102, 10909-10912.
Pujadas, M., et al. (2000), Passive remote sensing of nitrogen dioxide as a tool for tracking air pollution in urban areas: the Madrid urban plume, a case of study, Atmos Environ, 34, 3041-3056.
Richter, A., et al. (2005), Increase in tropospheric nitrogen dioxide over China observed from space, Nature, 437, 129-132.
Scharf, P. C., et al. (2002), Remote sensing for nitrogen management, Journal Of Soil And Water Conservation, 57, 518-524.
Schimel, D. S. (1995), Terrestrial Biogeochemical Cycles - Global Estimates with Remote-Sensing, Remote Sensing of Environment, 51, 49-56.
Schindler, D. W., et al. (1985), Long-Term Ecosystem Stress - the Effects of Years of Experimental Acidification on a Small Lake, Science, 228, 1395-1401.
Schlemmer, M. R., et al. (2005), Remotely measuring chlorophyll content in corn leaves with differing nitrogen levels and relative water content, Agronomy Journal, 97, 106-112.
Schlesinger, W. H., et al. (1996), On the spatial pattern of soil nutrients in desert ecosystems, Ecology, 77, 364-374.
Seinfeld, J. H., and S. N. Pandis (1998), Atmospheric chemistry and physics: from air pollution to climate change, xxvii, 1326 p. pp., Wiley, New York.
Sellers, P., and D. Schimel (1993), Remote-Sensing Of The Land Biosphere And Biogeochemistry In The Eos Era - Science Priorities, Methods And Implementation - Eos Land Biosphere And Biogeochemical Cycles Panels, Global And Planetary Change, 7, 279-297.
Serrano, L., et al. (2002), Remote sensing of nitrogen and lignin in Mediterranean vegetation from AVIRIS data: Decomposing biochemical from structural signals, Remote Sensing Of Environment, 81, 355-364.
Sievering, H. (2001), Atmospheric Chemistry and Deposition, in Structure and function of an alpine ecosystem: Niwot Ridge, Colorado, edited by W. D. Bowman and T. R. Seastedt, pp. 32-44, Oxford University Press, Oxford; New York.
Smith, M. L., et al. (2003), Analysis of hyperspectral data for estimation of temperate forest canopy nitrogen concentration: Comparison between an airborne (AVIRIS) and a spaceborne (Hyperion) sensor, Ieee Transactions On Geoscience And Remote Sensing, 41, 1332-1337.
Smith, M. L., et al. (2002), Direct estimation of aboveground forest productivity through hyperspectral remote sensing of canopy nitrogen, Ecological Applications, 12, 1286-1302.
Steltzer, H., and W. D. Bowman (1998), Differential influence of plant species on soil nitrogen transformations within moist meadow Alpine tundra, Ecosystems, 1, 464-474.
Stowasser, M., et al. (2002), A characterization of the warm 1999 Arctic winter by observations and modeling: NOy partitioning and dynamics, Journal Of Geophysical Research-Atmospheres, 107.
Strickland, J. D. H. (1967), The ecology of plankton off La Jolla, California, in the period April through September, 1967, University of California Press, Berkeley, CA.
Stryer, L. (1995), Biochemistry, 4th ed., xxxiv, 1064 p. pp., W.H. Freeman, New York.
Switzer, A. C., et al. (2003), Mapping nitrate in the global ocean using remotely sensed sea surface temperature, Journal Of Geophysical Research-Oceans, 108.
Townsend, A. R., et al. (2003), Human health effects of a changing global nitrogen cycle, Front Ecol Environ, 1, 240-246.
Tso, T. L., and M. T. Leu (1996), Quantitative analysis of the infrared absorptivities of nitric acid ices aerosol existing in polar stratospheric clouds, Analytical Sciences, 12, 615-622.
Urban, J., et al. (2005), Odin/SMR limb observations of stratospheric trace gases: Validation of N2O, Journal Of Geophysical Research-Atmospheres, 110.
Ustin, S. L., et al. (1993), Remote sensing of ecological processes: A strategy for developing and testing ecological models using spectral mixture analysis, in Scaling physiological processes: leaf to globe, edited by J. R. Ehleringer and C. B. Field, pp. 339-357, Academic Press, San Diego.
Van Breemen, N., et al. (1982), Soil Acidification From Atmospheric Ammonium-Sulfate In Forest Canopy Throughfall, Nature, 299, 548-550.
Vane, G., and A. F. H. Goetz (1993), Terrestrial Imaging Spectrometry - Current Status, Future-Trends, Remote Sensing Of Environment, 44, 117-126.
Vitousek, P. M. (1994), Beyond global warming: Ecology and global change, Ecology, 75, 1861-1876.
Vitousek, P. M., et al. (1997), Human alteration of the global nitrogen cycle: Sources and consequences, Ecological Applications, 7, 737-750.
Vitousek, P. M., and R. W. Howarth (1991), Nitrogen Limitation on Land and in the Sea - How Can It Occur, Biogeochemistry, 13, 87-115.
Walker, M. D., et al. (2001), The Vegetation: Hierarchical Species-Environment Relationships, in Structure and function of an alpine ecosystem: Niwot Ridge, Colorado, edited by W. D. Bowman and T. R. Seastedt, pp. 99-127, Oxford University Press, Oxford; New York.
Wessman, C. A., et al. (1988), Remote-Sensing Of Canopy Chemistry And Nitrogen Cycling In Temperate Forest Ecosystems, Nature, 335, 154-156.
Wessman, C. A. (1992), Spatial Scales And Global Change - Bridging The Gap From Plots To Gcm Grid Cells, Annual Review Of Ecology And Systematics, 23, 175-200.
Wessman, C. A. (2006), Building up with a top-down approach: The role of remote sensing in deciphering functional and structural diversity, in Scaling and Uncertainty Analysis in Ecology: Methods and Applications, edited by J. Wu, et al., Columbia University Press, New York.
Wiens, J. A. (1989), Spatial Scaling In Ecology, Functional Ecology, 3, 385-397.
Zhao, C. J., et al. (2005), Predicting grain protein content of winter wheat using remote sensing data based on nitrogen status and water stress, International Journal Of Applied Earth Observation And Geoinformation, 7, 1-9.
Zhao, D. H., et al. (2004), Hyperspectral characteristic analysis of a developing cotton canopy under different nitrogen treatments, Agronomie, 24, 463-471.